Search Page

Showing 1 - 10 of 13
DM-85 - Point, Line, and Area Generalization

Generalization is an important and unavoidable part of making maps because geographic features cannot be represented on a map without undergoing transformation. Maps abstract and portray features using vector (i.e. points, lines and polygons) and raster (i.e pixels) spatial primitives which are usually labeled. These spatial primitives are subjected to further generalization when map scale is changed. Generalization is a contradictory process. On one hand, it alters the look and feel of a map to improve overall user experience especially regarding map reading and interpretive analysis. On the other hand, generalization has documented quality implications and can sacrifice feature detail, dimensions, positions or topological relationships. A variety of techniques are used in generalization and these include selection, simplification, displacement, exaggeration and classification. The techniques are automated through computer algorithms such as Douglas-Peucker and Visvalingam-Whyatt in order to enhance their operational efficiency and create consistent generalization results. As maps are now created easily and quickly, and used widely by both experts and non-experts owing to major advances in IT, it is increasingly important for virtually everyone to appreciate the circumstances, techniques and outcomes of generalizing maps. This is critical to promoting better map design and production as well as socially appropriate uses.

CV-21 - Map Reading

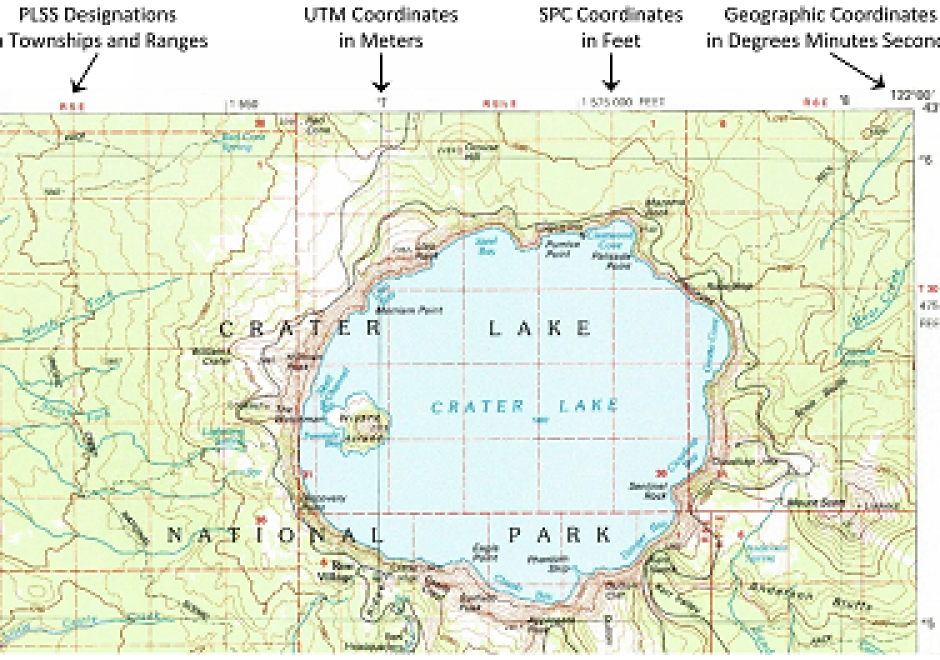
Map reading is the process of looking at the map to determine what is depicted and how the cartographer depicted it. This involves identifying the features or phenomena portrayed, the symbols and labels used, and information about the map that may not be displayed on the map. Reading maps accurately and effectively requires at least a basic understanding of how the mapmaker has made important cartographic decisions relating to map scale, map projections, coordinate systems, and cartographic compilation (selection, classification, generalization, and symbolization). Proficient map readers also appreciate artifacts of the cartographic compilation process that improve readability but may also affect map accuracy and uncertainty. Masters of map reading use maps to gain better understanding of their environment, develop better mental maps, and ultimately make better decisions. Through successful map reading, a person’s cartographic and mental maps will merge to tune the reader’s spatial thinking to the reality of the environment.

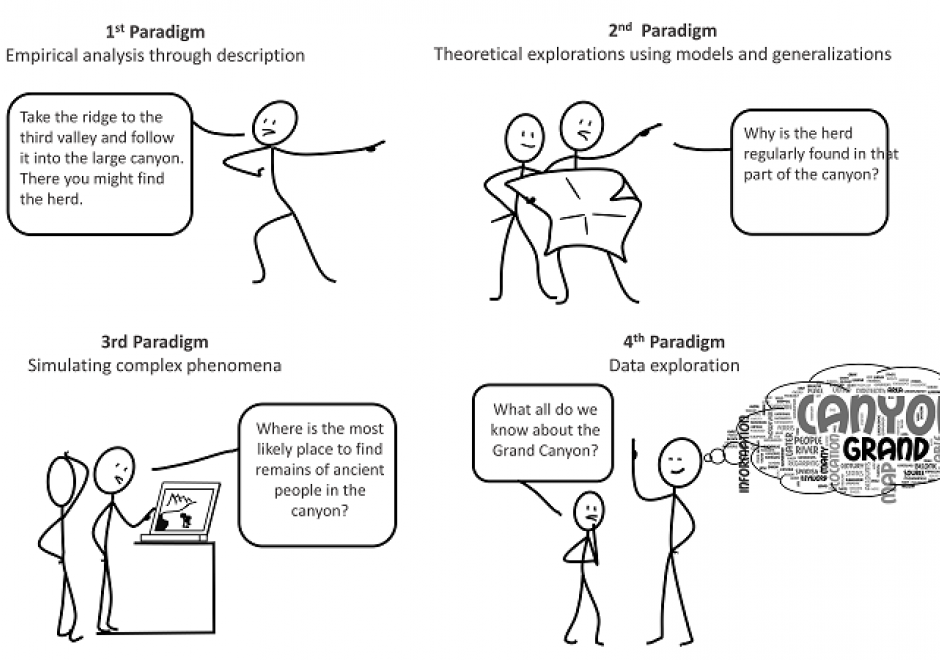
AM-21 - The Evolution of Geospatial Reasoning, Analytics, and Modeling

The field of geospatial analytics and modeling has a long history coinciding with the physical and cultural evolution of humans. This history is analyzed relative to the four scientific paradigms: (1) empirical analysis through description, (2) theoretical explorations using models and generalizations, (3) simulating complex phenomena and (4) data exploration. Correlations among developments in general science and those of the geospatial sciences are explored. Trends identify areas ripe for growth and improvement in the fourth and current paradigm that has been spawned by the big data explosion, such as exposing the ‘black box’ of GeoAI training and generating big geospatial training datasets. Future research should focus on integrating both theory- and data-driven knowledge discovery.

CV-08 - Symbolization and the Visual Variables

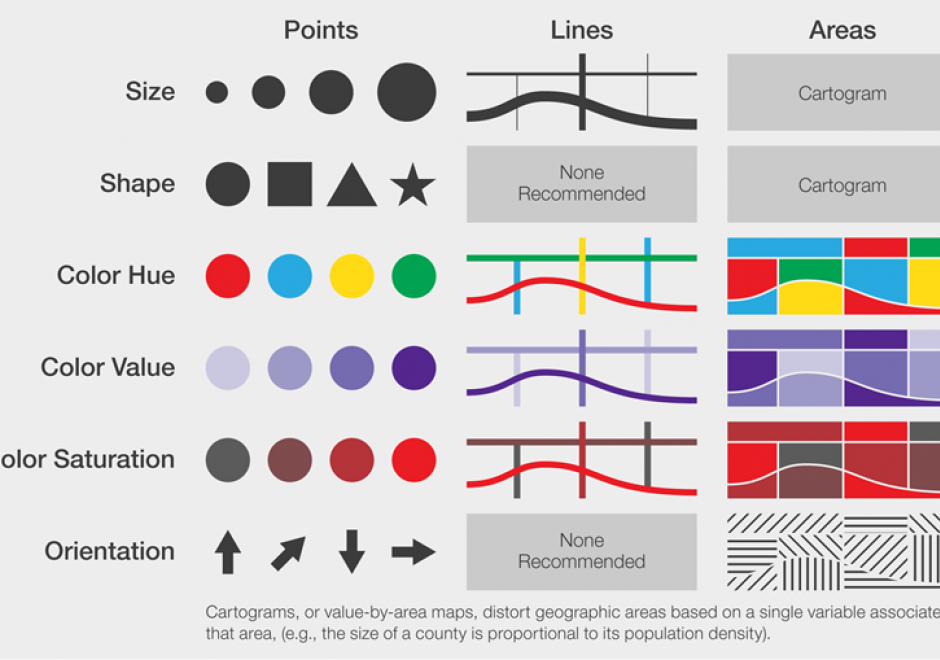
Maps communicate information about the world by using symbols to represent specific ideas or concepts. The relationship between a map symbol and the information that symbol represents must be clear and easily interpreted. The symbol design process requires first an understanding of the underlying nature of the data to be mapped (e.g., its spatial dimensions and level of measurement), then the selection of symbols that suggest those data attributes. Cartographers developed the visual variable system, a graphic vocabulary, to express these relationships on maps. Map readers respond to the visual variable system in predictable ways, enabling mapmakers to design map symbols for most types of information with a high degree of reliability.

AM-10 - Spatial Interaction

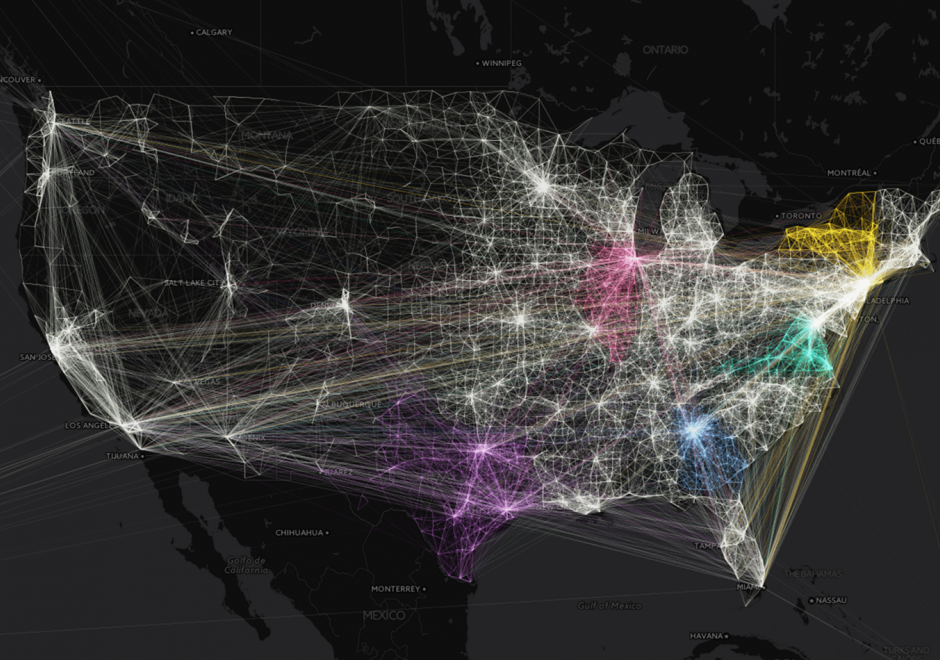
Spatial interaction (SI) is a fundamental concept in the GIScience literature, and may be defined in numerous ways. SI often describes the "flow" of individuals, commodities, capital, and information over (geographic) space resulting from a decision process. Alternatively, SI is sometimes used to refer to the influence of spatial proximity of places on the intensity of relations between those places. SI modeling as a separate research endeavor developed out of a need to mathematically model and understand the underlying determinants of these flows/influences. Proponents of SI modeling include economic geographers, regional scientists, and regional planners, as well as climate scientists, physicists, animal ecologists, and even some biophysical/environmental researchers. Originally developed from theories of interacting particles and gravitational forces in physics, SI modeling has developed through a series of refinements in terms of functional form, conceptual representations of distances, as well as a range of analytically rigorous technical improvements.
 

AM-106 - Error-based Uncertainty

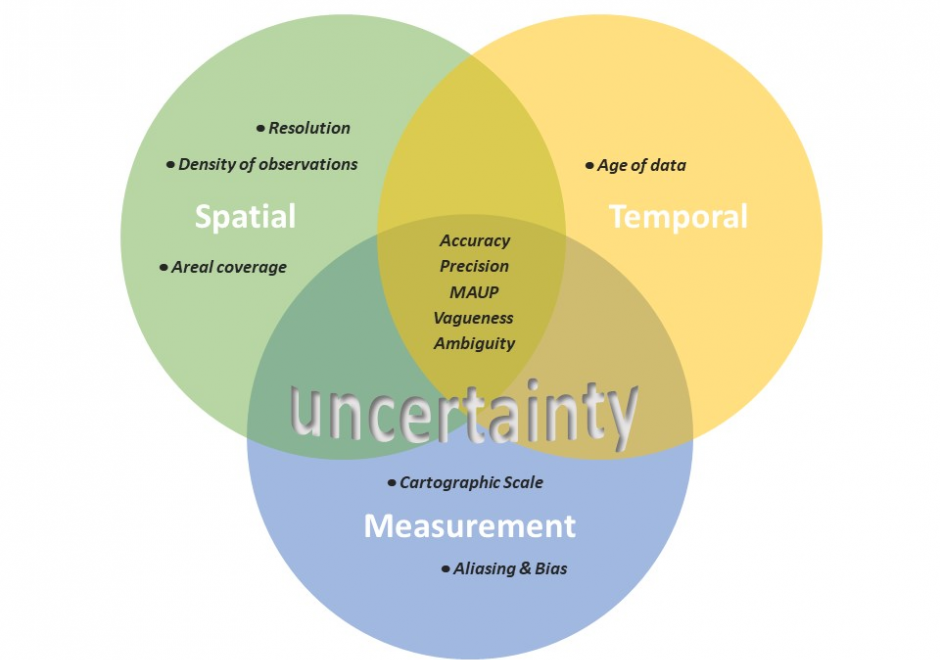
The largest contributing factor to spatial data uncertainty is error. Error is defined as the departure of a measure from its true value. Uncertainty results from: (1) a lack of knowledge of the extent and of the expression of errors and  (2) their propagation through analyses. Understanding error and its sources is key to addressing error-based uncertainty in geospatial practice. This entry presents a sample of issues related to error and error based uncertainty in spatial data. These consist of (1) types of error in spatial data, (2) the special case of scale and its relationship to error and (3) approaches to quantifying error in spatial data.

DC-29 - Volunteered Geographic Information

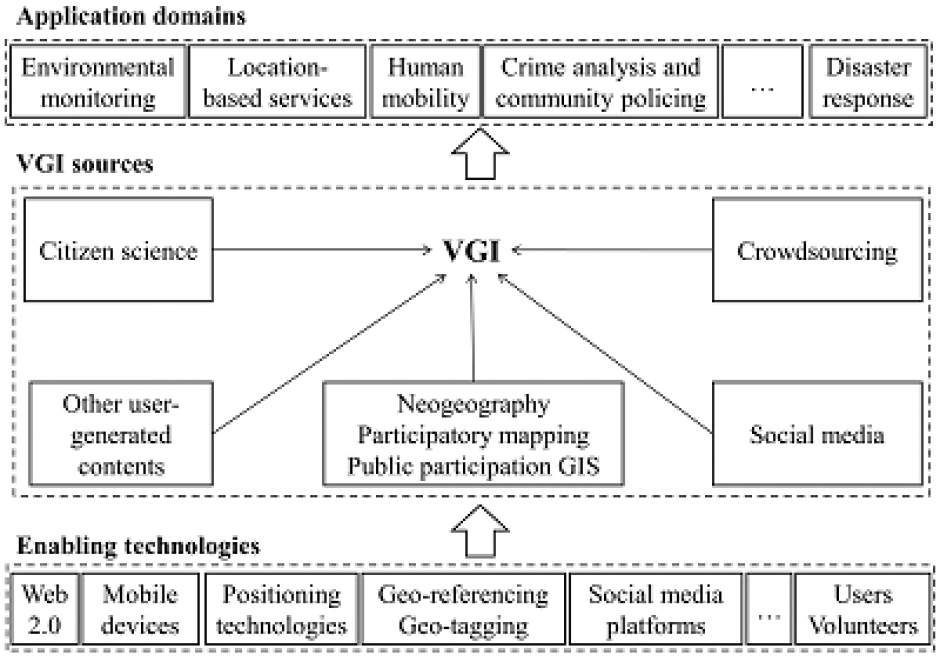
Volunteered geographic information (VGI) refers to geo-referenced data created by citizen volunteers. VGI has proliferated in recent years due to the advancement of technologies that enable the public to contribute geographic data. VGI is not only an innovative mechanism for geographic data production and sharing, but also may greatly influence GIScience and geography and its relationship to society. Despite the advantages of VGI, VGI data quality is under constant scrutiny as quality assessment is the basis for users to evaluate its fitness for using it in applications. Several general approaches have been proposed to assure VGI data quality but only a few methods have been developed to tackle VGI biases. Analytical methods that can accommodate the imperfect representativeness and biases in VGI are much needed for inferential use where the underlying phenomena of interest are inferred from a sample of VGI observations. VGI use for inference and modeling adds much value to VGI. Therefore, addressing the issue of representativeness and VGI biases is important to fulfill VGI’s potential. Privacy and security are also important issues. Although VGI has been used in many domains, more research is desirable to address the fundamental intellectual and scholarly needs that persist in the field.

FC-14 - Directional Operations

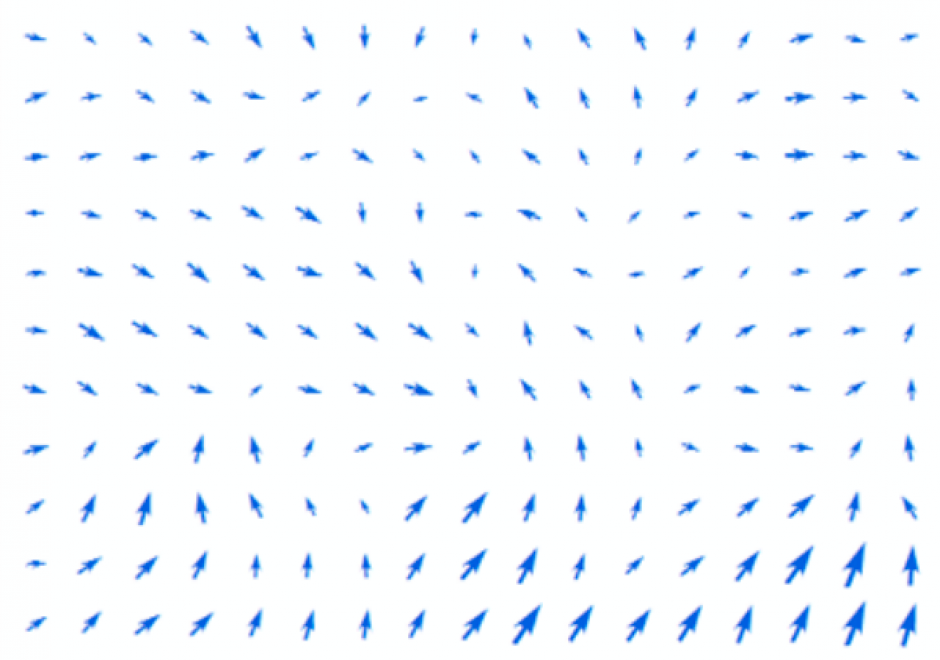
In the same manner as distance, direction plays an equally important role in GIS. This article first summarizes different ways of measuring direction, either quantitatively or qualitatively. Formulas and examples are provided. In the following discussion, fundamental differences between distance and direction in describing spatial relations is examined; properties of angles are emphasized in the context of GIS; and the classification of both cardinal and projective direction is illustrated. With a focus on quantitative operations, various directional operations are categorized and elaborated based on factors such as the underlying data model (vector or raster) and whether direction effect is explicitly or implicitly embedded in the data.

DC-25 - Changes in Geospatial Data Capture Over Time: Part 1, Technological Developments

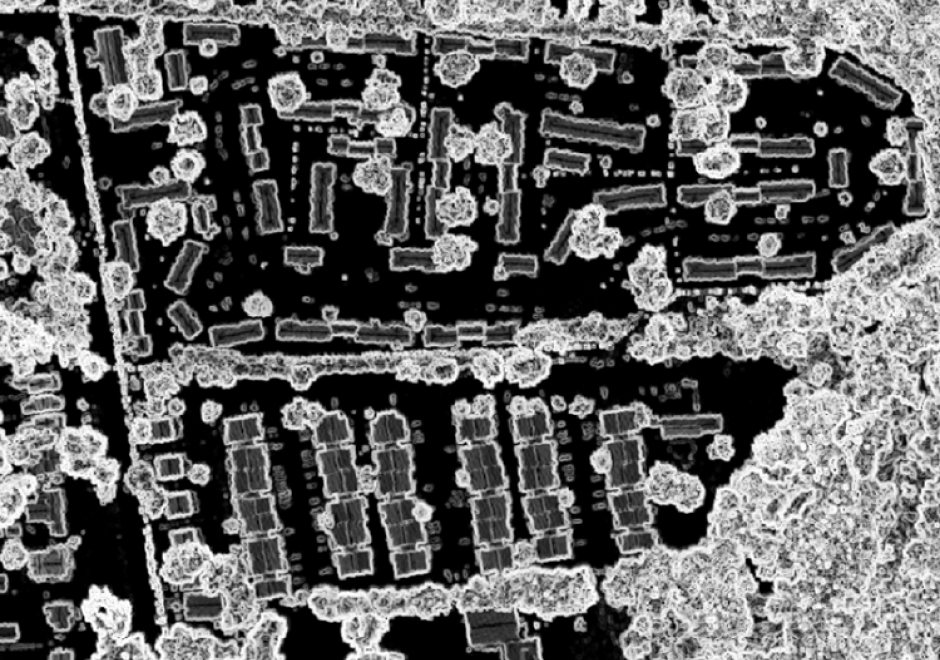
Geographic Information Systems (GIS) are fueled by geospatial data.  This comprehensive article reviews the evolution of procedures and technologies used to create the data that fostered the explosion of GIS applications. It discusses the need to geographically reference different types of information to establish an integrated computing environment that can address a wide range of questions. This includes the conversion of existing maps and aerial photos into georeferenced digital data.  It covers the advancements in manual digitizing procedures and direct digital data capture. This includes the evolution of software tools used to build accurate data bases. It also discusses the role of satellite based multispectral scanners for Earth observation and how LiDAR has changed the way that we measure and represent the terrain and structures. Other sections deal with building GIS data directly from street addresses and the construction of parcels to support land record systems. It highlights the way Global Positioning Systems (GPS) technology coupled with wireless networks and cloud-based applications have spatially empowered millions of users. This combination of technology has dramatically affected the way individuals search and navigate in their daily lives while enabling citizen scientists to be active participants in the capture of spatial data. For further information on changes to data capture, see Part 2: Implications and Case Studies. 

FC-10 - GIS Data Properties

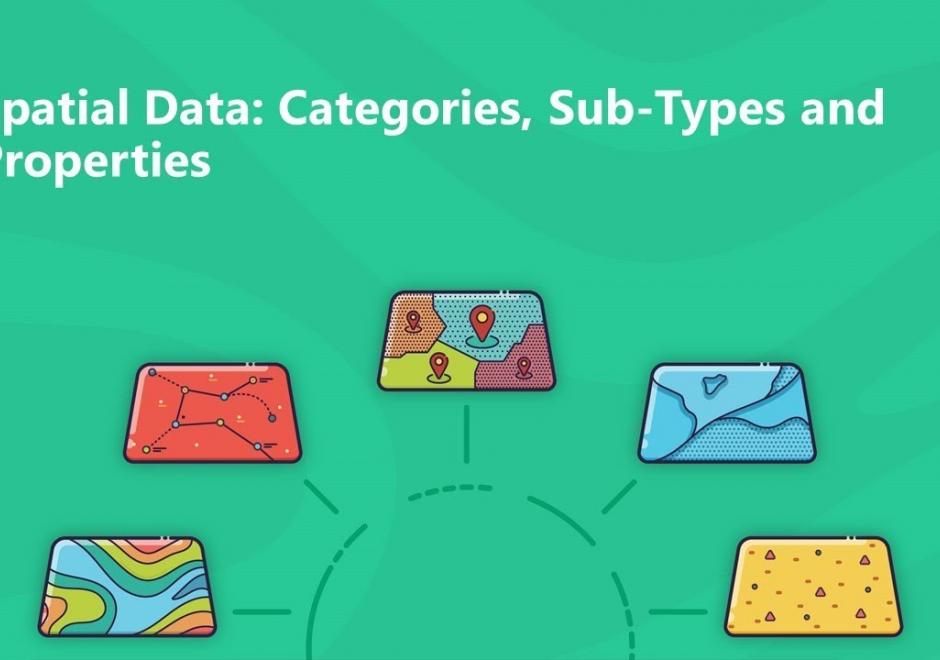
Data properties are characteristics of GIS attribute systems and values whose design and format impacts analytical and computational processing.  Geospatial data are expressed at conceptual, logical, and physical levels of database abstraction intended to represent geographical information. The appropriate design of attribute systems and selection of properties should be logically consistent and support appropriate scales of measurement for representation and analysis. Geospatial concepts such as object-field views and dimensional space for relating objects and qualities form data models based on a geographic matrix and feature geometry. Three GIS approaches and their attribute system design are described: tessellations, vectors, and graphs.

Pages