Search Page

Showing 1 - 10 of 14
CV-21 - Map Reading

Map reading is the process of looking at the map to determine what is depicted and how the cartographer depicted it. This involves identifying the features or phenomena portrayed, the symbols and labels used, and information about the map that may not be displayed on the map. Reading maps accurately and effectively requires at least a basic understanding of how the mapmaker has made important cartographic decisions relating to map scale, map projections, coordinate systems, and cartographic compilation (selection, classification, generalization, and symbolization). Proficient map readers also appreciate artifacts of the cartographic compilation process that improve readability but may also affect map accuracy and uncertainty. Masters of map reading use maps to gain better understanding of their environment, develop better mental maps, and ultimately make better decisions. Through successful map reading, a person’s cartographic and mental maps will merge to tune the reader’s spatial thinking to the reality of the environment.

CV-01 - Cartography and Science
"Science" is used both to describe a general, systematic approach to understanding the world and to refer to that approach as it is applied to a specific phenomenon of interest, for example, "geographic information science." The scientific method is used to develop theories that explain phenomena and processes. It consists of an iterative cycle of several steps: proposing a hypothesis, devising a way to make empirical observations that test that hypothesis, and finally, refining the hypothesis based on the empirical observations. "Scientific cartography" became a dominant mode of cartographic research and inquiry after World War II, when there was increased focus on the efficacy of particular design decisions and how particular maps were understood by end users. This entry begins with a brief history of the development of scientific cartographic approaches, including how they are deployed in map design research today. Next it discusses how maps have been used by scientists to support scientific thinking. Finally, it concludes with a discussion of how maps are used to communicate the results of scientific thinking.

CV-08 - Symbolization and the Visual Variables

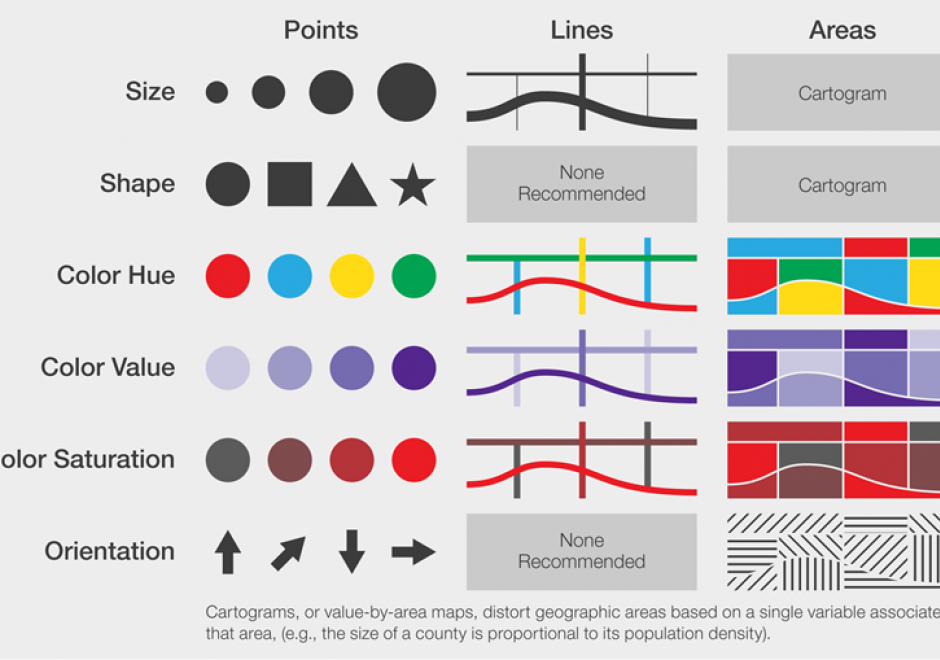
Maps communicate information about the world by using symbols to represent specific ideas or concepts. The relationship between a map symbol and the information that symbol represents must be clear and easily interpreted. The symbol design process requires first an understanding of the underlying nature of the data to be mapped (e.g., its spatial dimensions and level of measurement), then the selection of symbols that suggest those data attributes. Cartographers developed the visual variable system, a graphic vocabulary, to express these relationships on maps. Map readers respond to the visual variable system in predictable ways, enabling mapmakers to design map symbols for most types of information with a high degree of reliability.

DC-42 - Changes in Geospatial Data Capture Over Time: Part 2, Implications and Case Studies

Advances in technological approaches and tools to capture geospatial data have contributed to a vast collection of applications and enabled capacity for new programs, functions, products, workflows, and whole national-level spatial data infrastructure. In this entry, such outcomes and implications are described, focusing on developmental changes in specific application areas such as land use & land cover inventory, land parcel administration, and business, as well as examples from federal agencies, including the US Geological Survey, the Census Bureau, US Fish and Wildlife Service, and the US Department of Agriculture. These examples illustrate the diverse ways that the dramatic changes in geospatial data capture methods and approaches have affected workflows within agencies and have spatially empowered millions of users and the general public. For additional information on specific technical changes, see Part 1: 

DA-31 - GIS&T and Libraries, Archives, and Museums

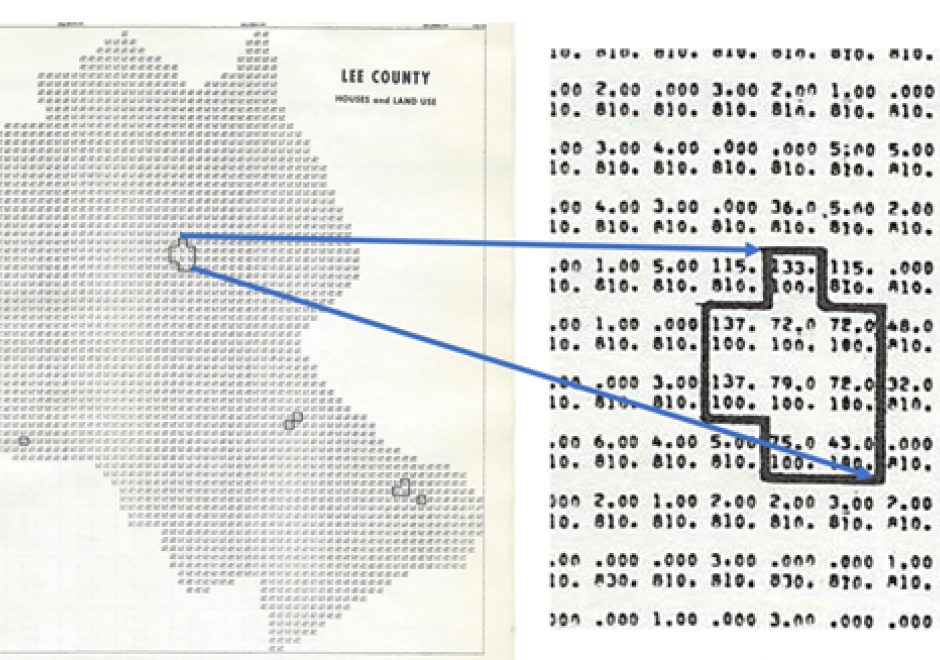
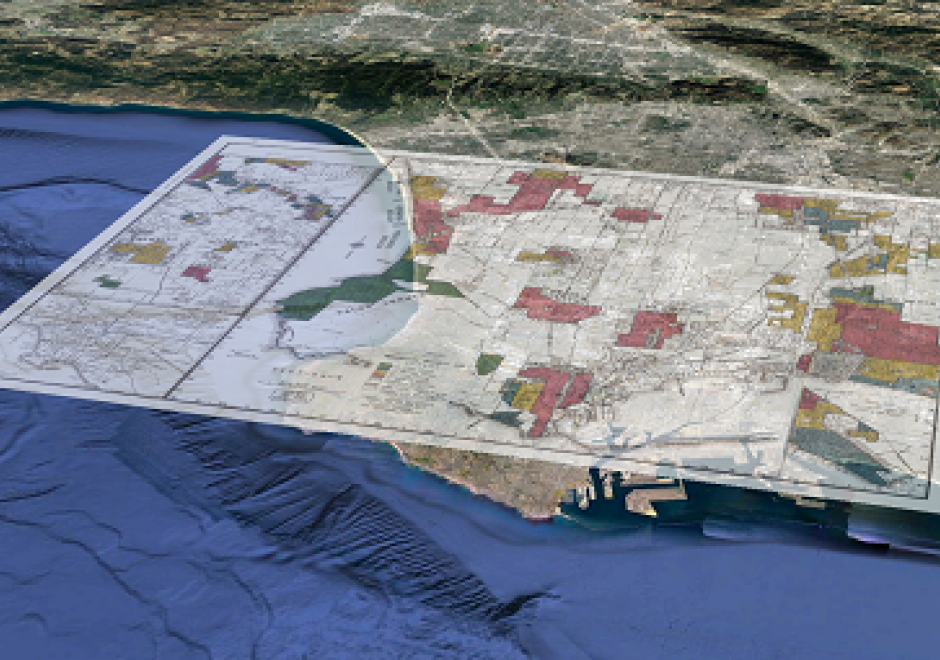
Libraries, archives, and museums (LAMs) are an important part of the GIS&T ecosystem and they engage in numerous activities that are critical for students, researchers, and practitioners. Traditionally these organizations have been at the forefront of developing infrastructures and services that connect researchers and others to historical and contemporary GIS data, including print maps. More recently, as a result of greater interest in spatial thinking and research, these organizations and institutions have become a place for instruction, outreach, and practice. This entry will discuss the historical role that LAMs have played in supporting and developing GIS&T as well as focus on current trends.

GS-26 - Mapping Spatial Justice for Marginal Societies

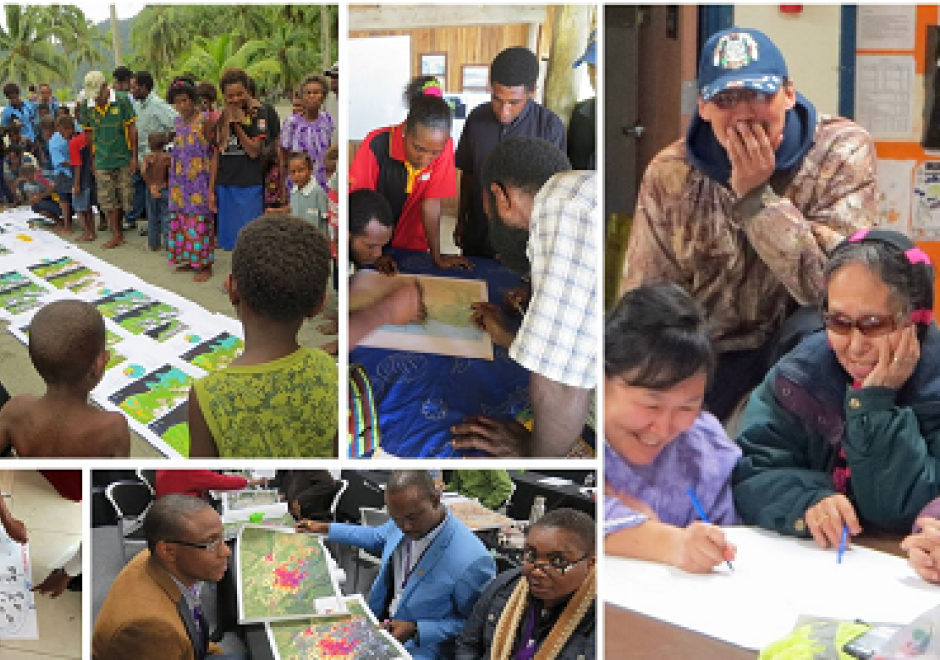
Marginal populations are those populations that are often overlooked by government, dependent upon non-governmental aid, and lack access to basic resources such as water, food, shelter, and security.  However, these groups are increasingly included in partnerships to map their resources (or lack thereof), develop basic applications in geospatial data collection, and devise innovative approaches to participatory mapping using geospatial technologies to address local and regional problems. Rapid technological changes and increased access to mobile geospatial tools enhance data creation efforts to map marginal populations and identify their needs. However, such mapping activities reveal fundamental inequities in collecting, disseminating, and visualizing spatial data.  This chapter defines marginal populations and provides an overview of data needs, geospatial tools, and ethical obligations necessary for these partnerships.

DC-29 - Volunteered Geographic Information

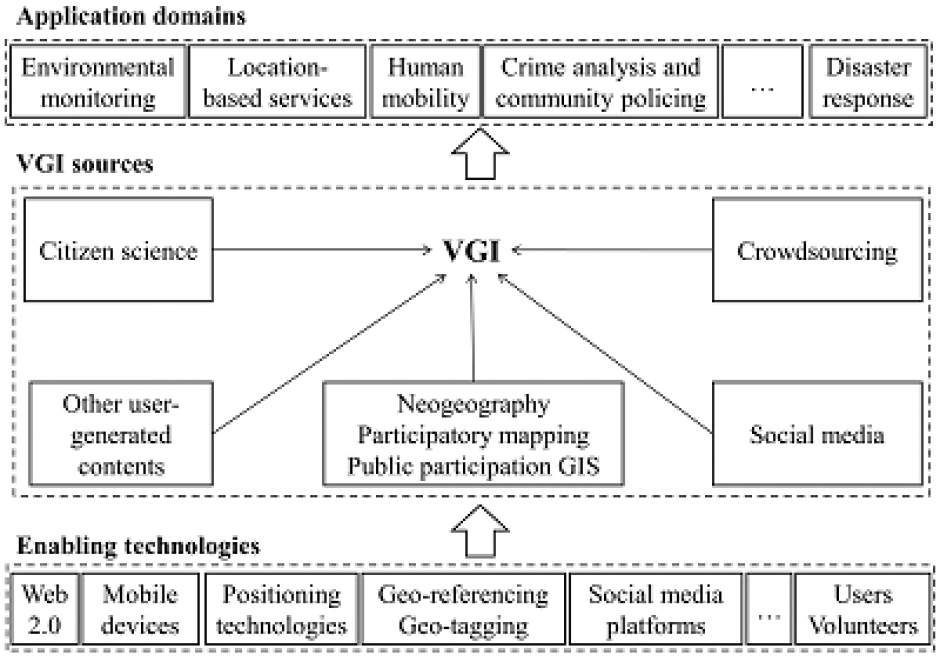
Volunteered geographic information (VGI) refers to geo-referenced data created by citizen volunteers. VGI has proliferated in recent years due to the advancement of technologies that enable the public to contribute geographic data. VGI is not only an innovative mechanism for geographic data production and sharing, but also may greatly influence GIScience and geography and its relationship to society. Despite the advantages of VGI, VGI data quality is under constant scrutiny as quality assessment is the basis for users to evaluate its fitness for using it in applications. Several general approaches have been proposed to assure VGI data quality but only a few methods have been developed to tackle VGI biases. Analytical methods that can accommodate the imperfect representativeness and biases in VGI are much needed for inferential use where the underlying phenomena of interest are inferred from a sample of VGI observations. VGI use for inference and modeling adds much value to VGI. Therefore, addressing the issue of representativeness and VGI biases is important to fulfill VGI’s potential. Privacy and security are also important issues. Although VGI has been used in many domains, more research is desirable to address the fundamental intellectual and scholarly needs that persist in the field.

FC-24 - Conceptual Models of Error and Uncertainty

Uncertainty and error are integral parts of science and technology, including GIS&T, as they are of most human endeavors. They are important characteristics of knowledge, which is very seldom perfect. Error and uncertainty both affect our understanding of the present and the past, and our expectations from the future. ‘Uncertainty’ is sometimes used as the umbrella term for a number of related concepts, of which ‘error’ is the most important in GIS and in most other data-intensive fields. Very often, uncertainty is the result of error (or suspected error).  As concepts, both uncertainty and error are complex, each having several different versions, interpretations, and kinds of impacts on the quality of GIS products, and on the uses and decisions that users may make on their basis. This section provides an overview of the kinds of uncertainty and common sources of error in GIS&T, the role of a number of additional related concepts in refining our understanding of different forms of imperfect knowledge, the problems of uncertainty and error in the context of decision-making, especially regarding actions with important future consequences, and some standard as well as more exploratory approaches to handling uncertainties about the future. While uncertainty and error are in general undesirable, they may also point to unsuspected aspects of an issue and thus help generate new insights.

CP-27 - GIS and Computational Notebooks

Researchers and practitioners across many disciplines have recently adopted computational notebooks to develop, document, and share their scientific workflows—and the GIS community is no exception. This chapter introduces computational notebooks in the geographical context. It begins by explaining the computational paradigm and philosophy that underlie notebooks. Next it unpacks their architecture to illustrate a notebook user’s typical workflow. Then it discusses the main benefits notebooks offer GIS researchers and practitioners, including better integration with modern software, more natural access to new forms of data, and better alignment with the principles and benefits of open science. In this context, it identifies notebooks as the “glue” that binds together a broader ecosystem of open source packages and transferable platforms for computational geography. The chapter concludes with a brief illustration of using notebooks for a set of basic GIS operations. Compared to traditional desktop GIS, notebooks can make spatial analysis more nimble, extensible, and reproducible and have thus evolved into an important component of the geospatial science toolkit.

AM-23 - Local Measures of Spatial Association

Local measures of spatial association are statistics used to detect variations of a variable of interest across space when the spatial relationship of the variable is not constant across the study region, known as spatial non-stationarity or spatial heterogeneity. Unlike global measures that summarize the overall spatial autocorrelation of the study area in one single value, local measures of spatial association identify local clusters (observations nearby have similar attribute values) or spatial outliers (observations nearby have different attribute values). Like global measures, local indicators of spatial association (LISA), including local Moran’s I and local Geary’s C, incorporate both spatial proximity and attribute similarity. Getis-Ord Gi*another popular local statistic, identifies spatial clusters at various significance levels, known as hot spots (unusually high values) and cold spots (unusually low values). This so-called “hot spot analysis” has been extended to examine spatiotemporal trends in data. Bivariate local Moran’s I describes the statistical relationship between one variable at a location and a spatially lagged second variable at neighboring locations, and geographically weighted regression (GWR) allows regression coefficients to vary at each observation location. Visualization of local measures of spatial association is critical, allowing researchers of various disciplines to easily identify local pockets of interest for future examination.

Pages