big data

CV-19 - Big Data Visualization

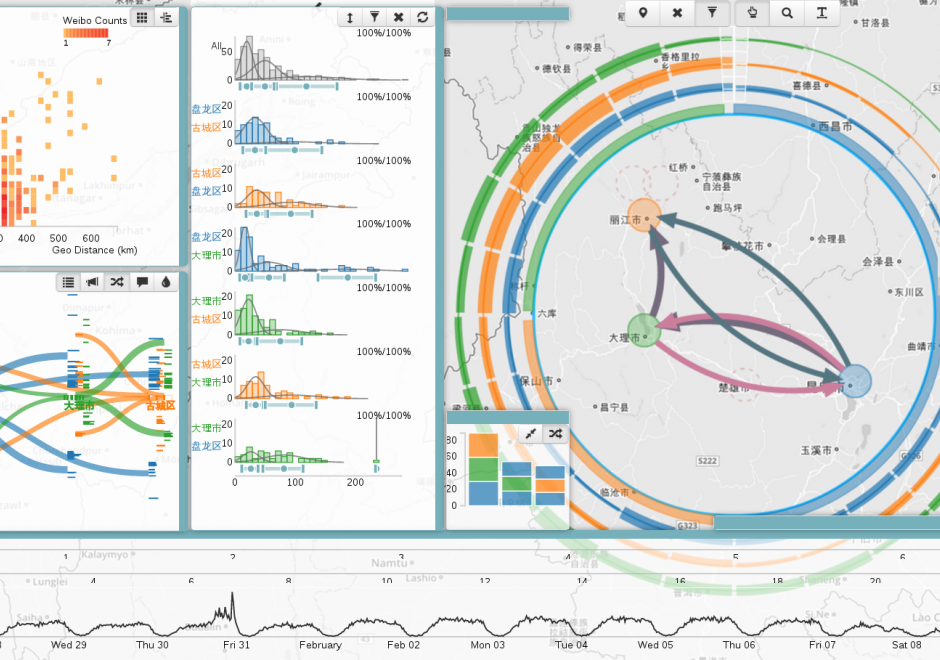
As new information and communication technologies have altered so many aspects of our daily lives over the past decades, they have simultaneously stimulated a shift in the types of data that we collect, produce, and analyze. Together, this changing data landscape is often referred to as "big data." Big data is distinguished from "small data" not only by its high volume but also by the velocity, variety, exhaustivity, resolution, relationality, and flexibility of the datasets. This entry discusses the visualization of big spatial datasets. As many such datasets contain geographic attributes or are situated and produced within geographic space, cartography takes on a pivotal role in big data visualization. Visualization of big data is frequently and effectively used to communicate and present information, but it is in making sense of big data – generating new insights and knowledge – that visualization is becoming an indispensable tool, making cartography vital to understanding geographic big data. Although visualization of big data presents several challenges, human experts can use visualization in general, and cartography in particular, aided by interfaces and software designed for this purpose, to effectively explore and analyze big data.

CP-23 - Google Earth Engine
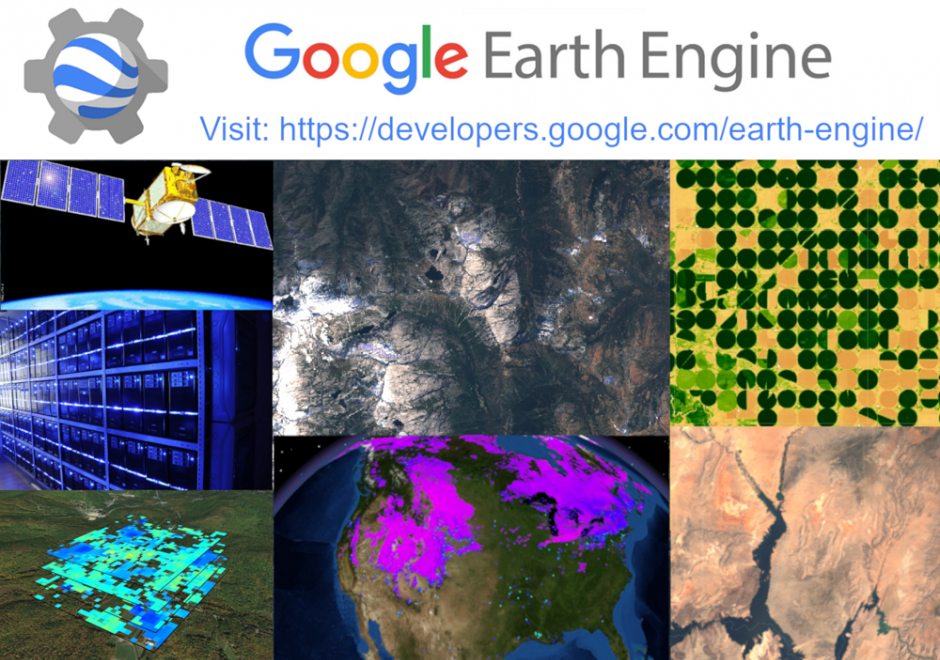
Google Earth Engine (GEE) is a cloud-based platform for planetary scale geospatial data analysis and communication.  By placing more than 17 petabytes of earth science data and the tools needed to access, filter, perform, and export analyses in the same easy to use application, users are able to explore and scale up analyses in both space and time without any of the hassles traditionally encountered with big data analysis.  Constant development and refinement have propelled GEE into one of the most advanced and accessible cloud-based geospatial analysis platforms available, and the near real time data ingestion and interface flexibility means users can go from observation to presentation in a single window.

CV-19 - Big Data Visualization

As new information and communication technologies have altered so many aspects of our daily lives over the past decades, they have simultaneously stimulated a shift in the types of data that we collect, produce, and analyze. Together, this changing data landscape is often referred to as "big data." Big data is distinguished from "small data" not only by its high volume but also by the velocity, variety, exhaustivity, resolution, relationality, and flexibility of the datasets. This entry discusses the visualization of big spatial datasets. As many such datasets contain geographic attributes or are situated and produced within geographic space, cartography takes on a pivotal role in big data visualization. Visualization of big data is frequently and effectively used to communicate and present information, but it is in making sense of big data – generating new insights and knowledge – that visualization is becoming an indispensable tool, making cartography vital to understanding geographic big data. Although visualization of big data presents several challenges, human experts can use visualization in general, and cartography in particular, aided by interfaces and software designed for this purpose, to effectively explore and analyze big data.

Pages