Cartography and Visualization

The Cartography & Visualization section encapsulates competencies related to the design and use of maps and mapping technology. This section covers core topics of reference and thematic maps design, as well as the emerging topics of interaction design, web map design, and mobile map design. This section also covers historical and contemporary influences on cartography and evolving data and critical considerations for map design and use.  

Topics in this Knowledge Area are listed thematically below. Existing topics are in regular font and linked directly to their original entries (published in 2006; these contain only Learning Objectives). Entries that have been updated and expanded are in bold. Forthcoming, future topics are italicized

History & Trends Map Design Techniques Interactive Design Techniques
Cartography & Science Common Thematic Map Types User Interface and User Experience (UI/UX) Design
Cartography & Art Multivariate Mapping Web Mapping
Cartography & Power Spatio-Temporal Representation Virtual & Immersive Environments
  Representing Uncertainty Big Data Visualization
  Terrain Representation Mobile Maps & Responsive Design
Data Considerations Cartograms Usability Engineering & Evaluation
Vector Formats & Sources Map Icon Design Geovisual Analytics
Raster Formats & Sources Narrative & Storytelling Geovisualization
  Flow Maps  
Map Design Fundamentals  Collaborative Cartography  
Scale & Generalization Map Use  
Statistical Mapping (Enumeration, Normalization, Classification) Lesson Design in Cartography Education  
Map Projections Map Reading  
Visual Hierarchy & Layout Map Interpretation  
Symbolization & the Visual Variables Map Analysis  
Color Theory    
Typography    
Design and Aesthetics    
Map Production and Management    


CV-19 - Big Data Visualization

As new information and communication technologies have altered so many aspects of our daily lives over the past decades, they have simultaneously stimulated a shift in the types of data that we collect, produce, and analyze. Together, this changing data landscape is often referred to as "big data." Big data is distinguished from "small data" not only by its high volume but also by the velocity, variety, exhaustivity, resolution, relationality, and flexibility of the datasets. This entry discusses the visualization of big spatial datasets. As many such datasets contain geographic attributes or are situated and produced within geographic space, cartography takes on a pivotal role in big data visualization. Visualization of big data is frequently and effectively used to communicate and present information, but it is in making sense of big data – generating new insights and knowledge – that visualization is becoming an indispensable tool, making cartography vital to understanding geographic big data. Although visualization of big data presents several challenges, human experts can use visualization in general, and cartography in particular, aided by interfaces and software designed for this purpose, to effectively explore and analyze big data.

CV-32 - Cartograms

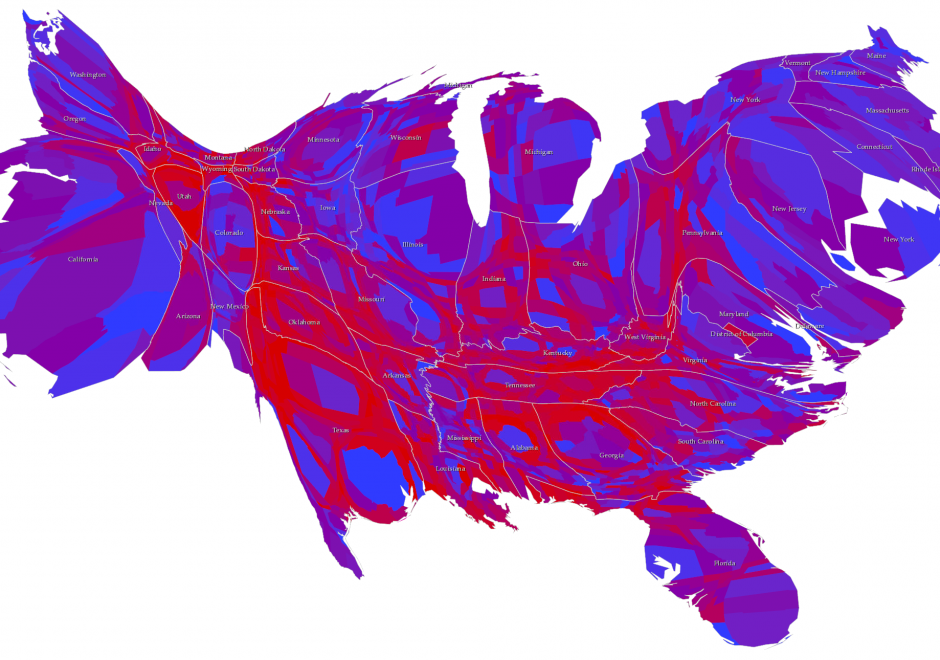
Cartograms are used for thematic mapping. They are a particular class of map type where some aspect of the geometry of the map is modified to accommodate the problem caused by perceptually different geographies. Standard thematic maps, such as the choropleth, have inherent biases simply due to the fact that areas will likely be very different in size from one another. The tendency to see larger areas as more important, regardless of the variable being mapped, can cause confusion. Cartograms tackle this by modifying the geography, effectively normalizing it to create a map where each area takes on a new shape and/or size based on the variable being mapped. Cartograms therefore depict geographical space diagrammatically as they lose their relationship with true coordinate system geometry. There are four main types of cartogram which each represent the mapped variable differently – non-contiguous, contiguous, graphical and gridded.  

CV-27 - Cartography and Art

The intersections between art and cartography go far beyond the notions of design and illustration, since mapmaking invariably has multiple cultural, social, and political dimensions. Considering this broader perspective, this entry provides a review of these different contemporary intersections, by exploring three main types of relationships: 1) cartography influenced by artistic practices; 2) map art or maps embedded in artistic practices; and 3) cartography at the interface between art and places. These will be discussed in detail following a brief overview of the main historical markers from which these types of relationships between art and cartography have emerged.

CV-26 - Cartography and Power

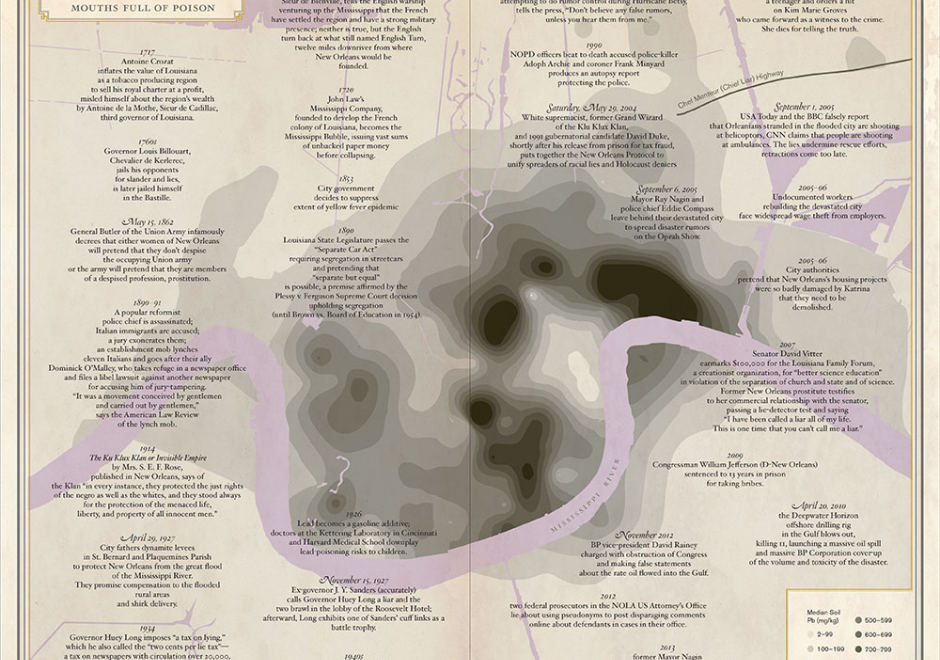
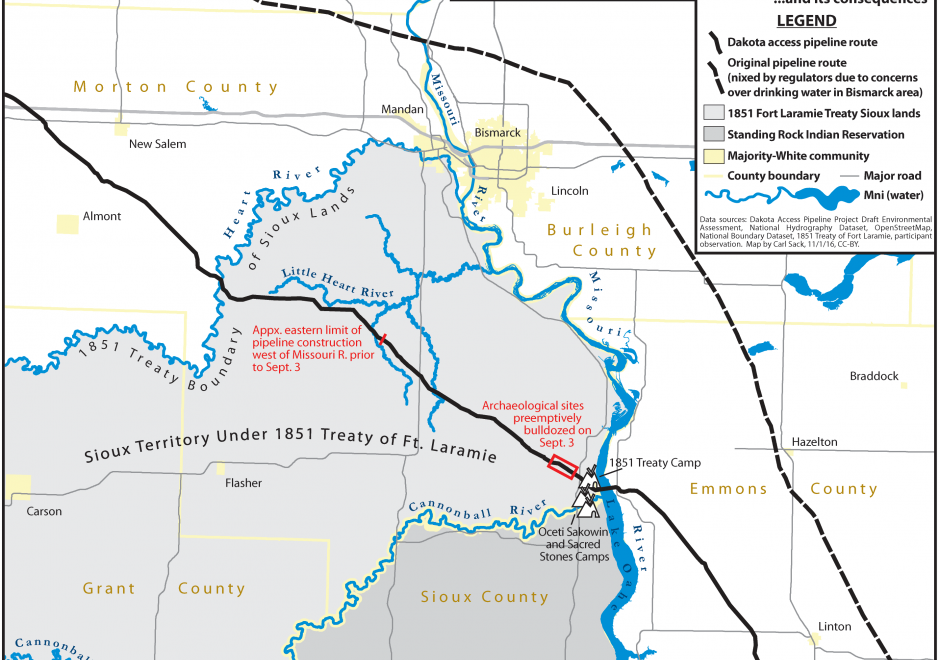
Over twenty five years ago, Brian Harley (1989, p. 2) implored cartographers to “search for the social forces that have structured cartography and to locate the presence of power – and its effects – in all map knowledge.” In the intervening years, while Harley has become a bit of a touchstone for citational practices acknowledging critical cartography (Edney, 2015), both theoretical understandings of power as well as the tools and technologies that go into cartographic production have changed drastically. This entry charts some of the many ways that power may be understood to manifest within and through maps and mapmaking practices. To do so, after briefly situating work on cartography and power historically, it presents six critiques of cartography and power in the form of dialectics. First, building from Harley’s earlier work, it defines a deconstructivist approach to mapping and places it in contrast to hermeneutic phenomenological approaches. Second, it places state-sanctioned practices of mapping against participatory and counter-mapping ones. Third, epistemological understanding of maps and their affects are explored through the dialectic of the map as a static object versus more processual, ontogenetic understandings of maps. Finally, the chapter concludes by suggesting the incomplete, heuristic nature of both the approaches and ideas explored here as well as the practices of critical cartography itself. Additional resources for cartographers and GIScientists seeking to further explore critical approaches to maps are provided.

CV-01 - Cartography and Science

"Science" is used both to describe a general, systematic approach to understanding the world and to refer to that approach as it is applied to a specific phenomenon of interest, for example, "geographic information science." The scientific method is used to develop theories that explain phenomena and processes. It consists of an iterative cycle of several steps: proposing a hypothesis, devising a way to make empirical observations that test that hypothesis, and finally, refining the hypothesis based on the empirical observations. "Scientific cartography" became a dominant mode of cartographic research and inquiry after World War II, when there was increased focus on the efficacy of particular design decisions and how particular maps were understood by end users. This entry begins with a brief history of the development of scientific cartographic approaches, including how they are deployed in map design research today. Next it discusses how maps have been used by scientists to support scientific thinking. Finally, it concludes with a discussion of how maps are used to communicate the results of scientific thinking.

CV-02 - Cartography and Technology
  • Discuss the impact that mapping on the Web via applications such as Google Earth have had on the practice of cartography
  • Explain how emerging technologies in related fields (e.g., the stereoplotter, aerial and satellite imagery, GPS and LiDAR, the World Wide Web, immersive and virtual environments) have advanced cartography and visualization methods
  • Explain how MacEachren’s Cartography-cubed (C3) concept can be used to understand the evolving role of cartography and visualization
  • Explain how software innovations such as Synagraphic Mapping System (SYMAP), Surfer, and automated contouring methods have affected the design of maps
  • Evaluate the advantages and limitations of various technological approaches to mapping
  • Select new technologies in related fields that have the most potential for use in cartography and visualization
CV-42 - Collaborative Cartography

Collaborative cartography is a newly emerging approach for engaging community-centered processes of map production to represent harm caused by oppressive systems and pathways for healed futures. While mapping has a long history of engagement in activist movements, community involvement is often segmented to considerations determining the topic of the map and the subsequent supporting data-collection/validation processes. Collaborative cartography, however, ensures that communities are also central to discussions around and implementation of the design of the map. While the cartographic processes may differ from those of a professional cartographer, the term cartography and cartographer are used (rather than mapping or mapmaker) to indicate the close attention to design this technique facilitates. A collaborative cartographer commits to work that supports community control, embraces multiple forms of knowledge, and engages in non-linear and iterative process. These three key elements work together to support the production of a map whose standards of effectiveness are defined specifically by the needs, desires, and goals of those who produced it. This may lead to the creation of maps that fall outside of traditional expectations of cartographic design, aesthetic, and function. However, such creative ruptures are considered a necessary aspect in the pursuit of community empowerment and liberation.

CV-09 - Color Theory

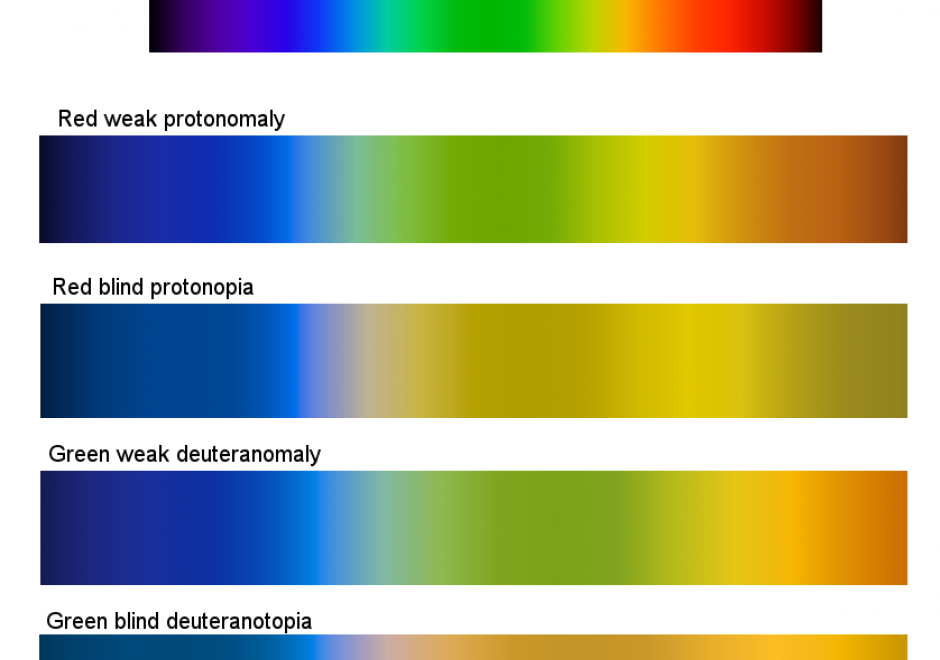
Color is the result of the visual perception of an energy source. It is described by its physical characteristics, mainly as a tridimensional variable modeled into a color space. Online tools exist to facilitate the use of color schemes to design a color palette, for artists, web designers, statisticians, etc. Colors in maps and visualizations must be combined to promote the visual hierarchy and harmony, balancing legibility, perceptual processing, and aesthetics. Color is a powerful visual variable and requires understanding the perception of color relationships. Existing color schemes are very useful to select a suitable color palette. As color is not experienced similarly across all map readers, issues about real-world connotations, conventions, specific color contrasts, and adaptation to color visual deficiencies and devices, are also to be taken into account when designing a color palette. This entry describes the main guidelines regarding color theory and related design practices as applied to map or geovisualization design.

CV-11 - Common Thematic Map Types

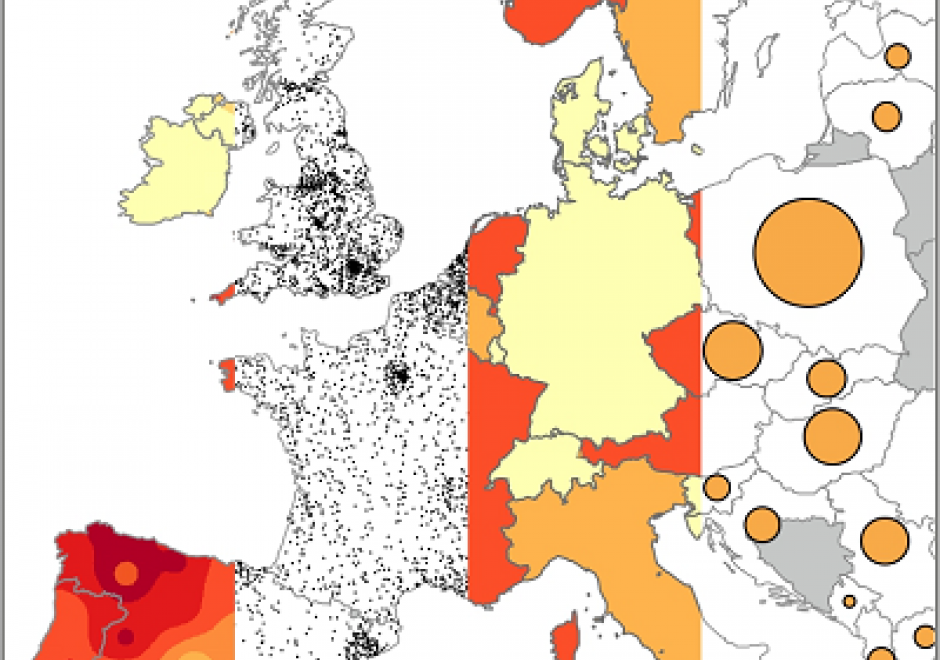
Thematic maps cover a wide variety of mapping solutions, and include choropleth, proportional symbol, isoline, dot density, dasymetric, and flow maps as well as cartograms, among others. Each thematic map type requires a different data processing method and employs different visual variables, resulting in representations that are either continuous or discrete and smooth or abrupt. As a result, each solution highlights different aspects of the mapped phenomena and shapes the message for the map readers differently. Thematic maps are tools for understanding spatial patterns, and the choice of thematic map type should support this understanding. Therefore, the main consideration when selecting a thematic map type is the purpose of the map and the nature of the underlying spatial patterns.

This entry reviews the common types of thematic maps, describes the visual variables that are applied in them, and provides design considerations for each thematic map type, including their legends. It also provides an overview of the relative strengths and limitations of each thematic map type.

CV-29 - Design and Aesthetics

Design and aesthetics are fundamental to cartographic practice. Developing students’ skills in design and aesthetics is a critical part of cartography education, yet design is also one of the most difficult part of the cartographic process. The cartographic design process of planning, creating, critiquing, and revising maps provides a method for making maps with intentional design decisions, utilizing an understanding of aesthetics to promote clarity and cohesion to attract the user and facilitate an emotional response. In this entry, cartographic design and the cartographic design process are reviewed, and the concepts of aesthetics, style, and taste are explained in the context of cartographic design.

Pages