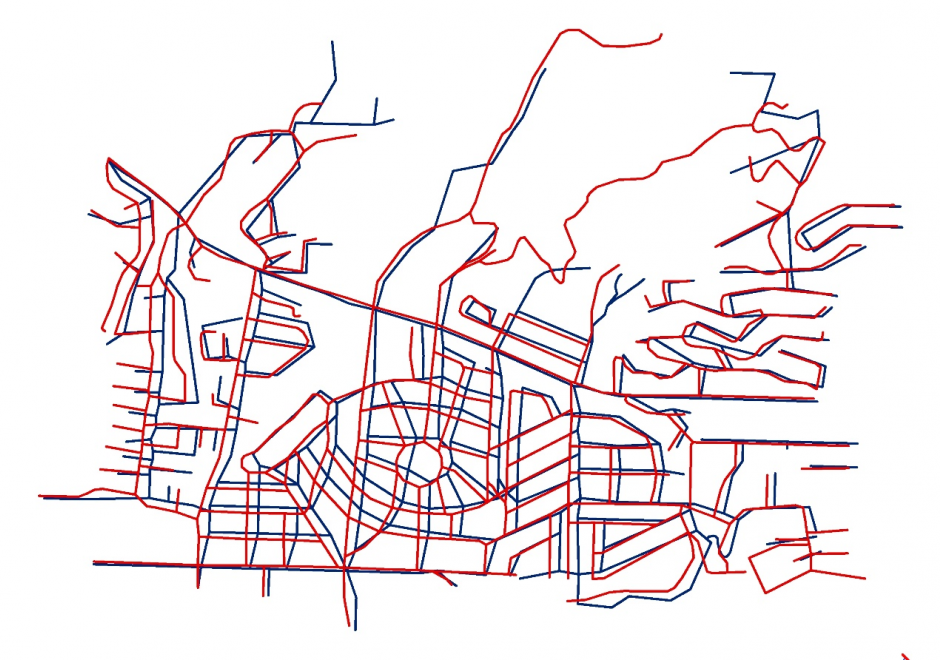
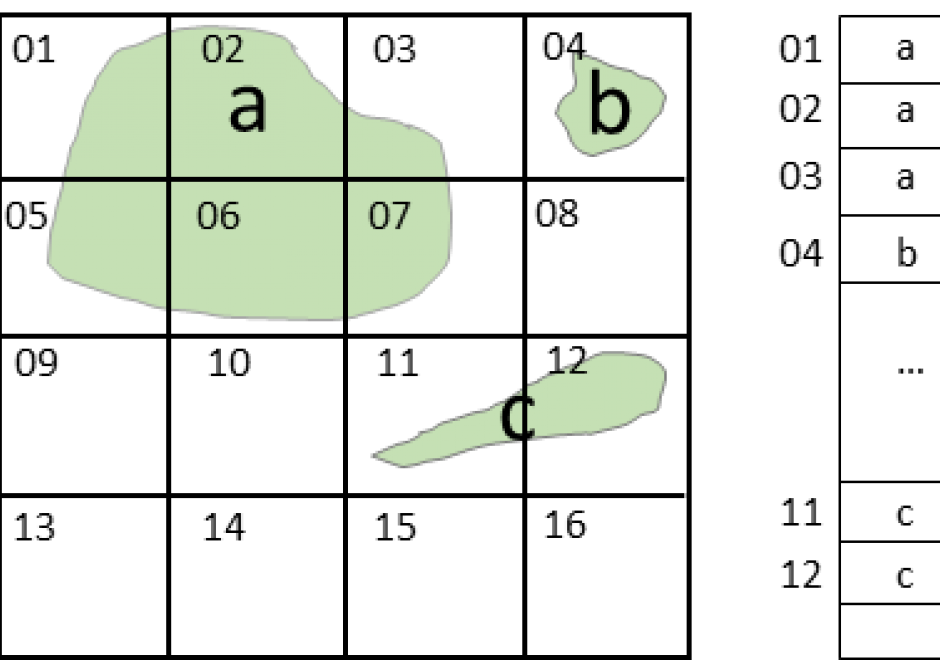
Shape is important in GI Science because the shape of a geographical entity can have far-reaching effects on significant characteristics of that entity. In geography we are mainly concerned with two-dimensional shapes such as the outlines of islands, lakes, and administrative areas, but three-dimensional shapes may become important, for example in the treatment of landforms. Since the attribute of shape has infinitely many degrees of freedom, there can be no single numerical measure such that closely similar shapes are assigned close numerical values. Therefore different shape descriptors have been proposed for different purposes. Although it is generally desirable for a shape descriptor to be scale invariant and rotation invariant, not all proposed descriptors satisfy both these requirements. Some methods by which a shape is described using a single number are described, followed by a discussion of moment-based approaches. It is often useful to represent a complex shape by means of a surrogate shape of simpler form which facilitates storage, manipulation, and comparison between shapes; some examples of commonly used shape surrogates are presented. Another important task is to compare different shapes to determine how similar they are. The article concludes with a discussion of a number of such measures of similarity.
Conduct an experiment using simulation techniques from an activity perspective
Explain how a simulation from an activity perspective can be used in transportation
Discuss important computational laboratory tools for creating new models and visualizing model simulations and model outcomes
Discuss whether, when prior information is absent, repeatedly generating random synthetic datasets can be used to provide statistical significance
Discuss Monte Carlo simulation use in GIS&T
Discuss effective scientific use of supervisory genetic algorithms with agent-based simulation models
Describe how supervisory search and optimization methods can be used to analyze key characteristics of initial conditions and results and to optimize results based on systematic targeted search through the parameter and random seed spaces
Explain the argument that, throughout history, maps have been used to depict social relations
Explain the argument that GIS is “socially constructed”
Describe the use of GIS from a political ecology point of view (e.g., consider the use of GIS for resource identification, conservation, and allocation by an NGO in Sub-Saharan Africa)
Defend or refute the contention that critical studies have an identifiable influence on the development of the information society in general and GIScience in particular
Discuss the production, maintenance, and use of geospatial data by a government agency or private firm from the perspectives of a taxpayer, a community organization, and a member of a minority group
Explain how a tax assessor’s office adoption of GIS&T may affect power relations within a community
Social media streams have emerged as new sources to support various geospatial applications. However, traditional geospatial tools and systems lack the capacities to process such data streams, which are generated dynamically in extremely large volumes and with versatile contents. Therefore, innovative approaches and frameworks should be developed to detect an emerging event discussed over the social media, understand the extent, consequences of the event, as well as it time-evolving nature, and eventually discover useful patterns. In order to harness social media for geospatial applications, this entry introduces social media analytics technologies for harvesting, managing, mining, analyzing and visualizing the spatial, temporal, text, and network information of social media data.
Recognize the unique constraints or opportunities of the social or cultural context of a potential application
Compare and contrast the needs, constraints, and opportunities of different types of institutions, such as corporations, non-profit organizations, government agencies, and educational institutions
Describe the major geospatial software architectures available currently, including desktop GIS, server-based, Internet, and component-based custom applications
Describe non-spatial software that can be used in geospatial applications, such as databases, Web services, and programming environments
Compare and contrast the primary sources of geospatial software, including major and minor commercial vendors and open-source options
List the major functionality needed from off-the-shelf software based on a requirements report
Identify software options that meet functionality needs for a given task or enterprise
Evaluate software options that meet functionality needs for a given task or enterprise
Differentiate between absolute and relative descriptions of location
Define the four basic dimensions or shapes used to describe spatial objects (i.e., points, lines, regions, volumes)
Discuss the contributions that different perspectives on the nature of space bring to an understanding of geographic phenomenon
Justify the discrepancies between the nature of locations in the real world and representations thereof (e.g., towns as points)
Select appropriate spatial metaphors and models of phenomena to be represented in GIS
Develop methods for representing non-cartesian models of space in GIS
Discuss the advantages and disadvantages of the use of cartesian/metric space as a basis for GIS and related technologies
Differentiate between common-sense, Cartesian/metric, relational, relativistic, phenomenological, social constructivist, and other theories of the nature of space
The scientific term spatial autocorrelation describes Tobler’s first law of geography: everything is related to everything else, but nearby things are more related than distant things. Spatial autocorrelation has a:
past characterized by scientists’ non-verbal awareness of it, followed by its formalization;
present typified by its dissemination across numerous disciplines, its explication, its visualization, and its extension to non-normal data; and
an anticipated future in which it becomes a standard in data analytic computer software packages, as well as a routinely considered feature of space-time data and in spatial optimization practice.
Positive spatial autocorrelation constitutes the focal point of its past and present; one expectation is that negative spatial autocorrelation will become a focal point of its future.
FC-15 - Shape
Shape is important in GI Science because the shape of a geographical entity can have far-reaching effects on significant characteristics of that entity. In geography we are mainly concerned with two-dimensional shapes such as the outlines of islands, lakes, and administrative areas, but three-dimensional shapes may become important, for example in the treatment of landforms. Since the attribute of shape has infinitely many degrees of freedom, there can be no single numerical measure such that closely similar shapes are assigned close numerical values. Therefore different shape descriptors have been proposed for different purposes. Although it is generally desirable for a shape descriptor to be scale invariant and rotation invariant, not all proposed descriptors satisfy both these requirements. Some methods by which a shape is described using a single number are described, followed by a discussion of moment-based approaches. It is often useful to represent a complex shape by means of a surrogate shape of simpler form which facilitates storage, manipulation, and comparison between shapes; some examples of commonly used shape surrogates are presented. Another important task is to compare different shapes to determine how similar they are. The article concludes with a discussion of a number of such measures of similarity.