visual communication

PD-28 - Visual Programming for GIS Applications

Visual programming languages (VPLs) in GIS applications are used to design the automatic processing of spatial data in an easy visual form. The resulted visual workflow is useful when the same processing steps need to be repeated on different spatial data (e.g. other areas, another period). In the case of visual programming languages, simple graphical symbols represent spatial operations implemented in GIS software (tools, geoalgorithms). Users can create a sequence of operation in a simple visual form, like a chain of graphical symbols. Visual programs can be stored and reused. The graphical form is useful to non-programmers who are not familiar with a textual programming language, as is the case with many professionals such as urban planners, facility managers, ecologists and other users of GIS. VPLs are implemented not only in GIS applications but also in remote sensing (RS) applications. Sometimes both types of applications are bundled together in one geospatial application that offers geoalgorithms in a shared VPL environment. Visual programming languages are an integral part of software engineering (SE). Data flow and workflow diagrams are one of the oldest graphical representations in informatics.

CV-35 - Geovisualization
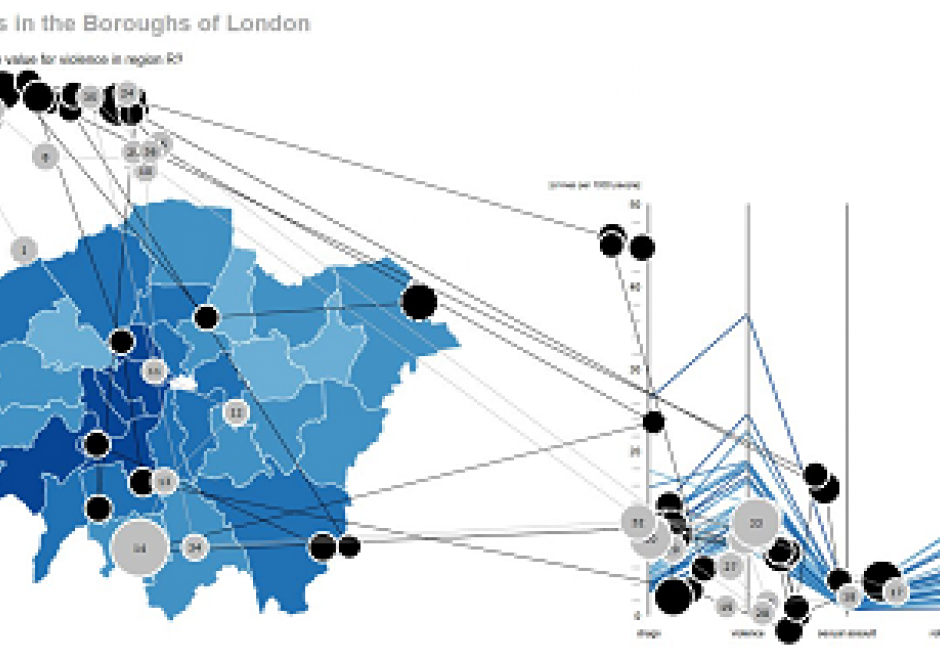
Geovisualization is primarily understood as the process of interactively visualizing geographic information in any of the steps in spatial analyses, even though it can also refer to the visual output (e.g., plots, maps, combinations of these), or the associated techniques. Rooted in cartography, geovisualization emerged as a research thrust with the leadership of Alan MacEachren (Pennsylvania State University) and colleagues when interactive maps and digitally-enabled exploratory data analysis led to a paradigm shift in 1980s and 1990s. A core argument for geovisualization is that visual thinking using maps is integral to the scientific process and hypothesis generation, and the role of maps grew beyond communicating the end results of an analysis or documentation process. As such, geovisualization interacts with a number of disciplines including cartography, visual analytics, information visualization, scientific visualization, statistics, computer science, art-and-design, and cognitive science; borrowing from and contributing to each. In this entry, we provide a definition and a brief history of geovisualization including its fundamental concepts, elaborate on its relationship to other disciplines, and briefly review the skills/tools that are relevant in working with geovisualization environments. We finish the entry with a list of learning objectives, instructional questions, and additional resources.

Pages