CV-14 - Terrain Representation
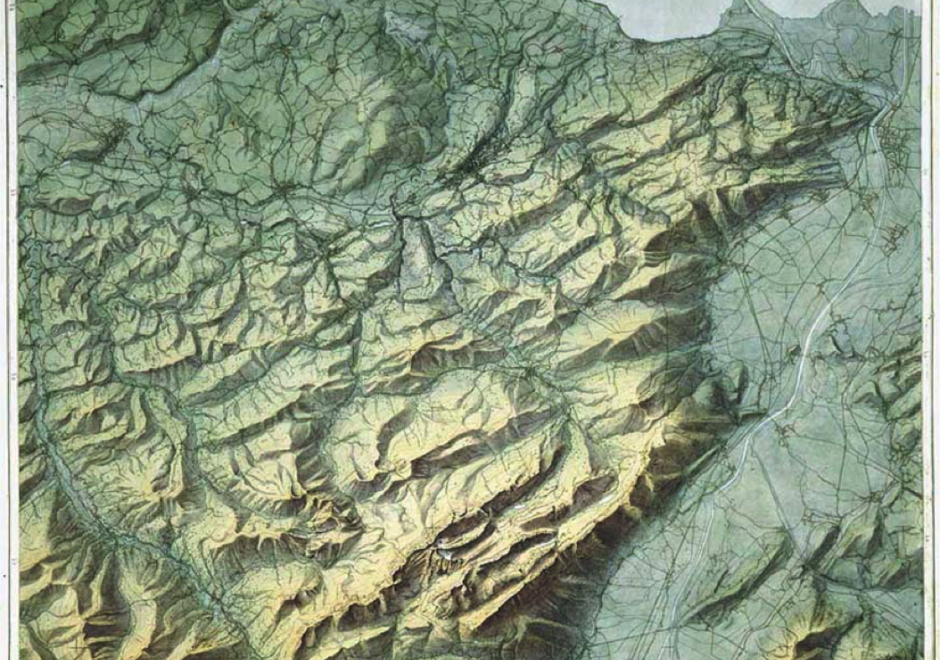
Terrain representation is the manner by which elevation data are visualized. Data are typically stored as 2.5D grid representations, including digital elevation models (DEMs) in raster format and triangulated irregular networks (TINs). These models facilitate terrain representations such as contours, shaded relief, spot heights, and hypsometric tints, as well as automate calculations of surface derivatives such as slope, aspect, and curvature. 3D effects have viewing directions perpendicular (plan), parallel (profile), or panoramic (oblique view) to the elevation’s vertical datum plane. Recent research has focused on automating, stylizing, and enhancing terrain representations. From the user’s perspective, representations of elevation are measurable or provide a 3D visual effect, with much overlap between the two. The ones a user can measure or derive include contours, hypsometric tinting, slope, aspect, and curvature. Other representations focus on 3D effect and may include aesthetic considerations, such as hachures, relief shading, physiographic maps, block diagrams, rock drawings, and scree patterns. Relief shading creates the 3D effect using the surface normal and illumination vectors with the Lambertian assumption. Non-plan profile or panoramic views are often enhanced by vertical exaggeration. Cartographers combine techniques to mimic or create mapping styles, such as the Swiss-style.

CV-32 - Cartograms
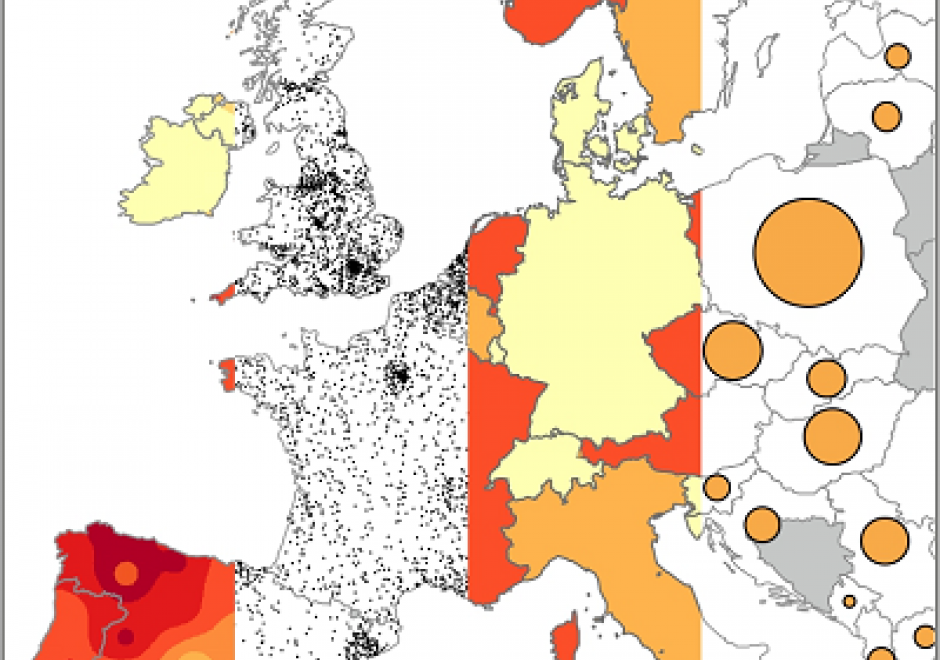
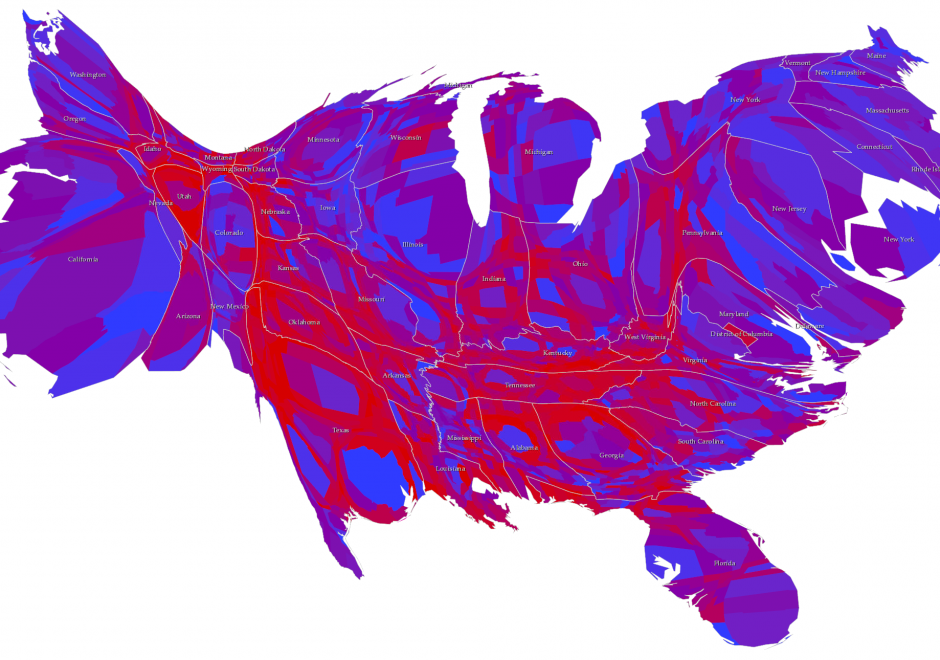
Cartograms are used for thematic mapping. They are a particular class of map type where some aspect of the geometry of the map is modified to accommodate the problem caused by perceptually different geographies. Standard thematic maps, such as the choropleth, have inherent biases simply due to the fact that areas will likely be very different in size from one another. The tendency to see larger areas as more important, regardless of the variable being mapped, can cause confusion. Cartograms tackle this by modifying the geography, effectively normalizing it to create a map where each area takes on a new shape and/or size based on the variable being mapped. Cartograms therefore depict geographical space diagrammatically as they lose their relationship with true coordinate system geometry. There are four main types of cartogram which each represent the mapped variable differently – non-contiguous, contiguous, graphical and gridded.