CV-18 - Representing Uncertainty
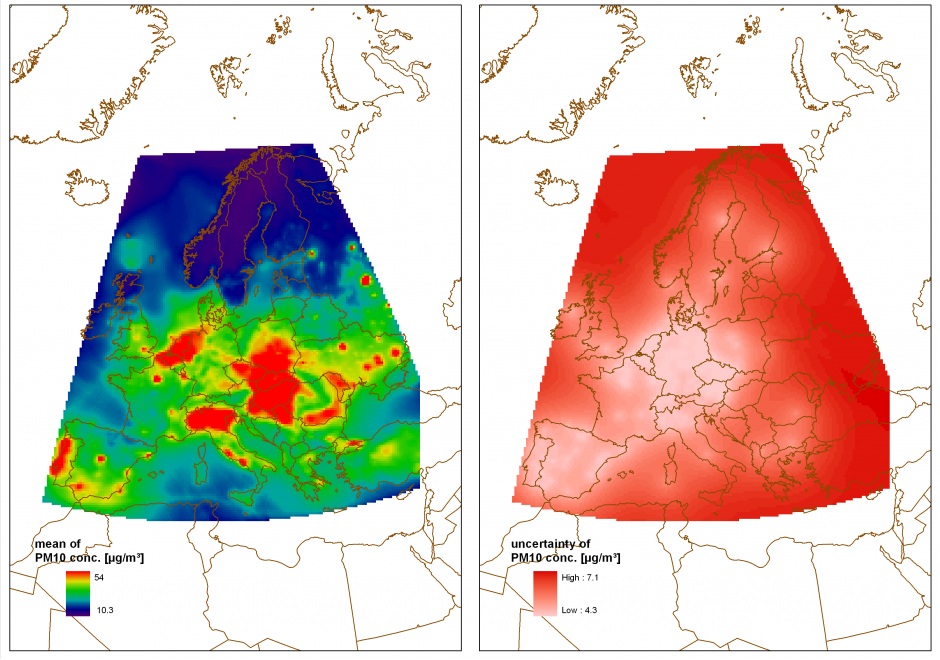
Using geospatial data involves numerous uncertainties stemming from various sources such as inaccurate or erroneous measurements, inherent ambiguity of the described phenomena, or subjectivity of human interpretation. If the uncertain nature of the data is not represented, ill-informed interpretations and decisions can be the consequence. Accordingly, there has been significant research activity describing and visualizing uncertainty in data rather than ignoring it. Multiple typologies have been proposed to identify and quantify relevant types of uncertainty and a multitude of techniques to visualize uncertainty have been developed. However, the use of such techniques in practice is still rare because standardized methods and guidelines are few and largely untested. This contribution provides an introduction to the conceptualization and representation of uncertainty in geospatial data, focusing on strategies for the selection of suitable representation and visualization techniques.

CV-32 - Cartograms
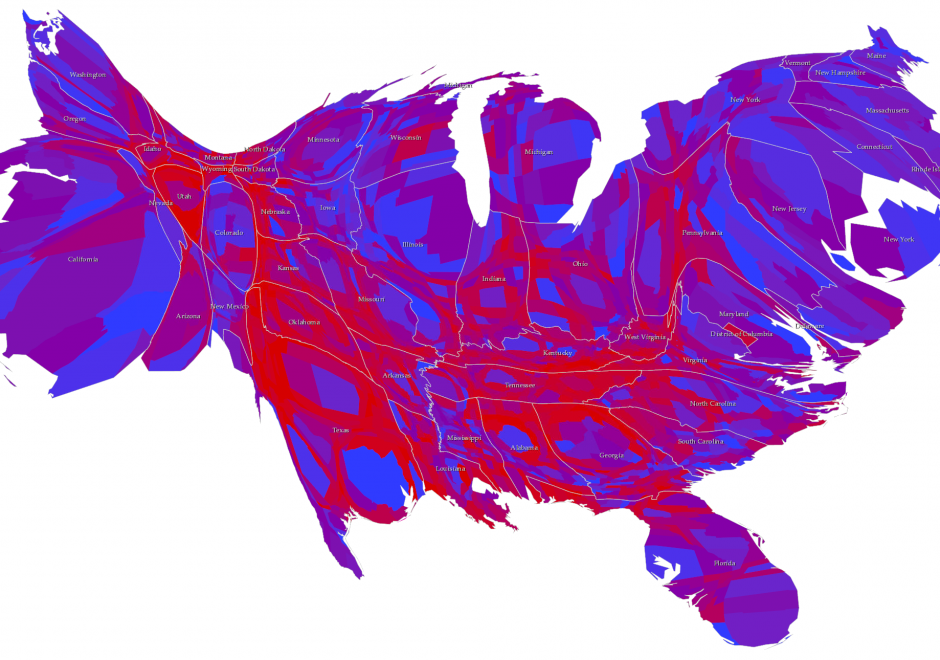
Cartograms are used for thematic mapping. They are a particular class of map type where some aspect of the geometry of the map is modified to accommodate the problem caused by perceptually different geographies. Standard thematic maps, such as the choropleth, have inherent biases simply due to the fact that areas will likely be very different in size from one another. The tendency to see larger areas as more important, regardless of the variable being mapped, can cause confusion. Cartograms tackle this by modifying the geography, effectively normalizing it to create a map where each area takes on a new shape and/or size based on the variable being mapped. Cartograms therefore depict geographical space diagrammatically as they lose their relationship with true coordinate system geometry. There are four main types of cartogram which each represent the mapped variable differently – non-contiguous, contiguous, graphical and gridded.