map design techniques

CV-14 - Terrain Representation
  • Describe situations in which methods of terrain representation (e.g., shaded relief, contours, hypsometric tints, block diagrams, profiles) are well suited
  • Create a map that represents both slope and aspect on the same map using the Moellering-Kimerling coloring method
  • Explain how maps that show the landscape in profile can be used to represent terrain
  • Differentiate 3-D representations from 21/2-D representations
  • Describe situations in which methods of terrain representation are poorly suited
CV-12 - Bivariate and Multivariate Maps
  • Differentiate the interpretation of a series of three maps and a single multivariate map, each representing the same three related variables
  • Design a single map symbol that can be used to symbolize a set of related variables
  • Create a map that displays related variables using different mapping methods (e.g., choropleth
  • and proportional symbol, choropleth and cartogram) Create a map that displays related variables using the same mapping method (e.g., bivariate choropleth map, bivariate dot map)
  • Design a map series to show the change in a geographic pattern over time
  • Detect a multivariate outlier using a combination of maps and graphs
  • Explain the relationship among several variables in a parallel coordinate plot
CV-11 - Common Thematic Map Types
  • Describe the design considerations for each of the following methods: choropleth, dasymetric, proportioned symbol, graduated symbol, isoline, dot, cartogram, and flow map
  • Evaluate the strengths and limitations of each of the following methods: choropleth, dasymetric, proportioned symbol, graduated symbol, isoline, dot, cartogram, and flow map
  • Explain why choropleth maps should (almost) never be used for mapping count data and suggest alternative methods for mapping count data
  • Choose suitable mapping methods for each attribute of a given type of feature in a GIS (e.g., roads with various attributes such as surface type, traffic flow, number of lanes, direction such as one-way)
  • Select base information suited to providing a frame of reference for thematic map symbols (e.g., network of major roads and state boundaries underlying national population map)
  • Create maps using each of the following methods: choropleth, dasymetric, proportioned symbol, graduated symbol, isoline, dot, cartogram, and flow
  • Create well-designed legends using the appropriate conventions for the following methods: choropleth, dasymetric, proportioned symbol, graduated symbol, isoline, dot, cartogram, and flow
CV-32 - Cartograms

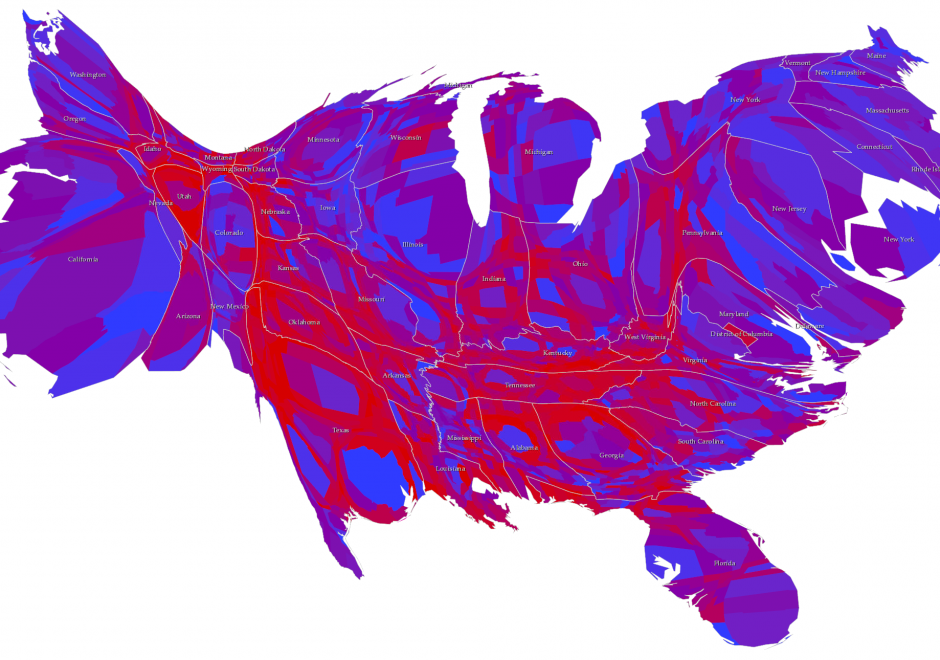
Cartograms are used for thematic mapping. They are a particular class of map type where some aspect of the geometry of the map is modified to accommodate the problem caused by perceptually different geographies. Standard thematic maps, such as the choropleth, have inherent biases simply due to the fact that areas will likely be very different in size from one another. The tendency to see larger areas as more important, regardless of the variable being mapped, can cause confusion. Cartograms tackle this by modifying the geography, effectively normalizing it to create a map where each area takes on a new shape and/or size based on the variable being mapped. Cartograms therefore depict geographical space diagrammatically as they lose their relationship with true coordinate system geometry. There are four main types of cartogram which each represent the mapped variable differently – non-contiguous, contiguous, graphical and gridded.  

CV-18 - Mapping Uncertainty
  • Describe a technique that can be used to represent the value of each of the components of data quality (positional and attribute accuracy, logical consistency, and completeness)
  • Apply multivariate and dynamic visualization methods to display uncertainty in data
  • Sketch a map with a reliability overlay using symbols suited to reliability representations
  • Develop graphic techniques that clearly show different forms of inexactness (e.g., existence uncertainty, boundary location uncertainty, attribute ambiguity, transitional boundary) of a given feature (e.g., a culture region)
CV-17 - Mapping Time
  • Describe how the adding time-series data reveals or does not reveal patterns not evident in a cross-sectional data
  • Describe how an animated map reveals patterns not evident without animation
  • Demonstrate how Bertin’s “graphic variables” can be extended to include animation effects
  • Create a temporal sequence representing a dynamic geospatial process
CV-14 - Terrain Representation
  • Describe situations in which methods of terrain representation (e.g., shaded relief, contours, hypsometric tints, block diagrams, profiles) are well suited
  • Create a map that represents both slope and aspect on the same map using the Moellering-Kimerling coloring method
  • Explain how maps that show the landscape in profile can be used to represent terrain
  • Differentiate 3-D representations from 21/2-D representations
  • Describe situations in which methods of terrain representation are poorly suited
CV-12 - Bivariate and Multivariate Maps
  • Differentiate the interpretation of a series of three maps and a single multivariate map, each representing the same three related variables
  • Design a single map symbol that can be used to symbolize a set of related variables
  • Create a map that displays related variables using different mapping methods (e.g., choropleth
  • and proportional symbol, choropleth and cartogram) Create a map that displays related variables using the same mapping method (e.g., bivariate choropleth map, bivariate dot map)
  • Design a map series to show the change in a geographic pattern over time
  • Detect a multivariate outlier using a combination of maps and graphs
  • Explain the relationship among several variables in a parallel coordinate plot
CV-11 - Common Thematic Map Types
  • Describe the design considerations for each of the following methods: choropleth, dasymetric, proportioned symbol, graduated symbol, isoline, dot, cartogram, and flow map
  • Evaluate the strengths and limitations of each of the following methods: choropleth, dasymetric, proportioned symbol, graduated symbol, isoline, dot, cartogram, and flow map
  • Explain why choropleth maps should (almost) never be used for mapping count data and suggest alternative methods for mapping count data
  • Choose suitable mapping methods for each attribute of a given type of feature in a GIS (e.g., roads with various attributes such as surface type, traffic flow, number of lanes, direction such as one-way)
  • Select base information suited to providing a frame of reference for thematic map symbols (e.g., network of major roads and state boundaries underlying national population map)
  • Create maps using each of the following methods: choropleth, dasymetric, proportioned symbol, graduated symbol, isoline, dot, cartogram, and flow
  • Create well-designed legends using the appropriate conventions for the following methods: choropleth, dasymetric, proportioned symbol, graduated symbol, isoline, dot, cartogram, and flow
CV-18 - Mapping Uncertainty
  • Describe a technique that can be used to represent the value of each of the components of data quality (positional and attribute accuracy, logical consistency, and completeness)
  • Apply multivariate and dynamic visualization methods to display uncertainty in data
  • Sketch a map with a reliability overlay using symbols suited to reliability representations
  • Develop graphic techniques that clearly show different forms of inexactness (e.g., existence uncertainty, boundary location uncertainty, attribute ambiguity, transitional boundary) of a given feature (e.g., a culture region)

Pages