AM-03 - Buffers

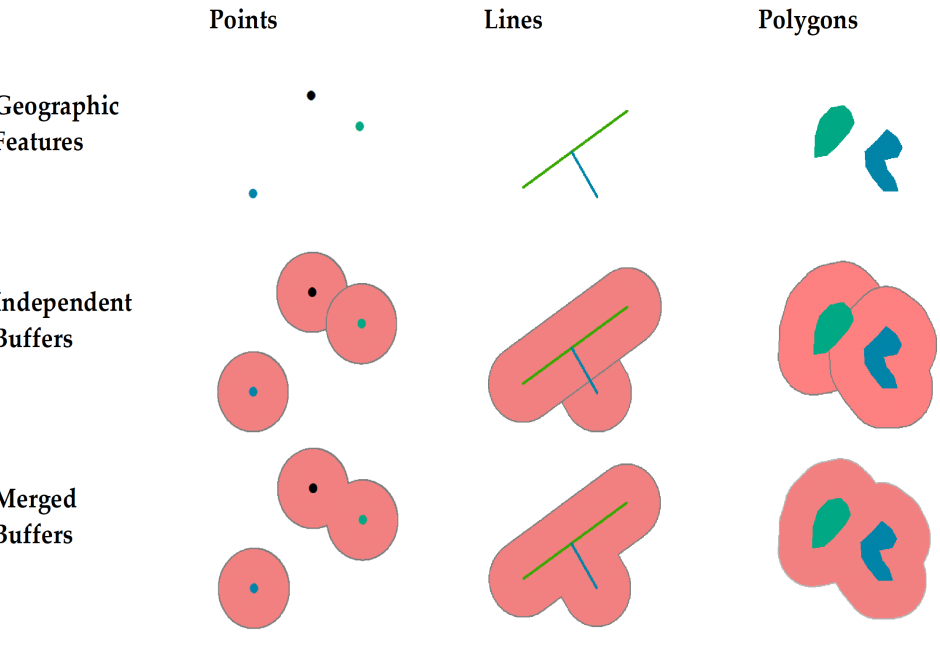
This short article introduces the definition of buffer and explains how buffers are created for single or multiple geographic features of different geometric types. It also discusses how buffers are generated differently in vector and raster data models and based on the concept of cost.

CV-19 - Big Data Visualization
As new information and communication technologies have altered so many aspects of our daily lives over the past decades, they have simultaneously stimulated a shift in the types of data that we collect, produce, and analyze. Together, this changing data landscape is often referred to as "big data." Big data is distinguished from "small data" not only by its high volume but also by the velocity, variety, exhaustivity, resolution, relationality, and flexibility of the datasets. This entry discusses the visualization of big spatial datasets. As many such datasets contain geographic attributes or are situated and produced within geographic space, cartography takes on a pivotal role in big data visualization. Visualization of big data is frequently and effectively used to communicate and present information, but it is in making sense of big data – generating new insights and knowledge – that visualization is becoming an indispensable tool, making cartography vital to understanding geographic big data. Although visualization of big data presents several challenges, human experts can use visualization in general, and cartography in particular, aided by interfaces and software designed for this purpose, to effectively explore and analyze big data.