All Topics

A B C D E F G H I J K L M N O P R S T U V W
CV-04 - Scale and Generalization

Scale and generalization are two fundamental, related concepts in geospatial data. Scale has multiple meanings depending on context, both within geographic information science and in other disciplines. Typically it refers to relative proportions between objects in the real world and their representations. Generalization is the act of modifying detail, usually reducing it, in geospatial data. It is often driven by a need to represent data at coarsened resolution, being typically a consequence of reducing representation scale. Multiple computations and graphical modication processes can be used to achieve generalization, each introducing increased abstraction to the data, its symbolization, or both.

FC-32 - Semantic Information Elicitation
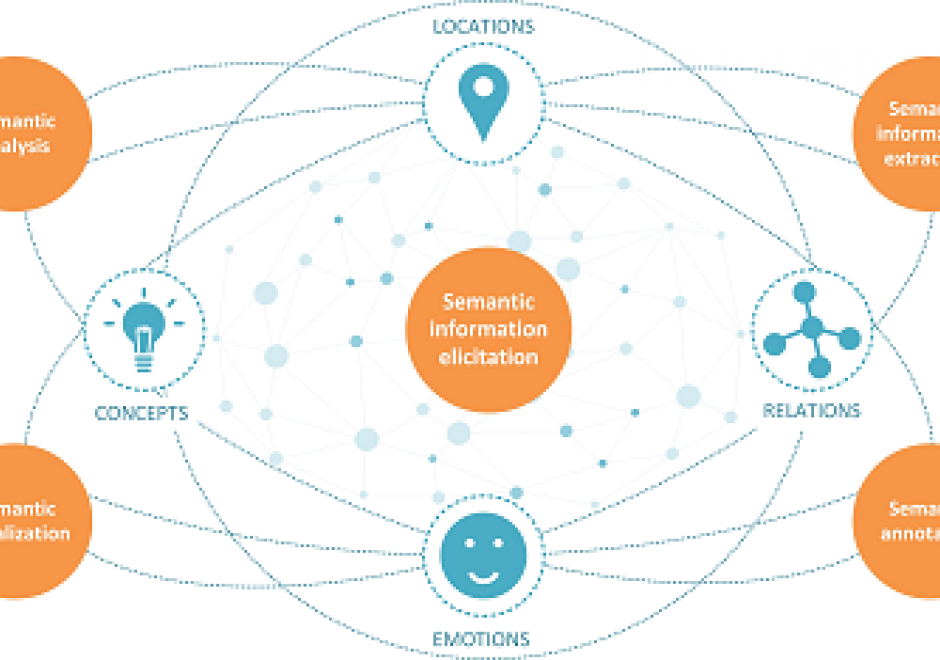
The past few decades have been characterized by an exponential growth of digital information resources. A considerable amount of this information is semi-structured, such as XML files and metadata records and unstructured, such as scientific reports, news articles, and historical archives. These resources include a wealth of latent knowledge in a form mainly intended for human use. Semantic information elicitation refers to a set of related processes: semantic information extraction, linking, and annotation that aim to make this knowledge explicit to help computer systems make sense of the content and support ontology construction, information organization, and knowledge discovery.

In the context of GIScience research, semantic information extraction aims at processing unstructured and semi-structured resources and identifying specific types of information: places, events, topics, geospatial concepts, and relations. These may be further linked to ontologies and knowledge bases to enrich the original unstructured content with well-defined meaning, provide access to information not explicit in the original sources, and support semantic annotation and search. Semantic analysis and visualization techniques are further employed to explore aspects latent in these sources such as the historical evolution of cities, the progression of phenomena and events and people’s perception of places and landscapes.

FC-11 - Set Theory

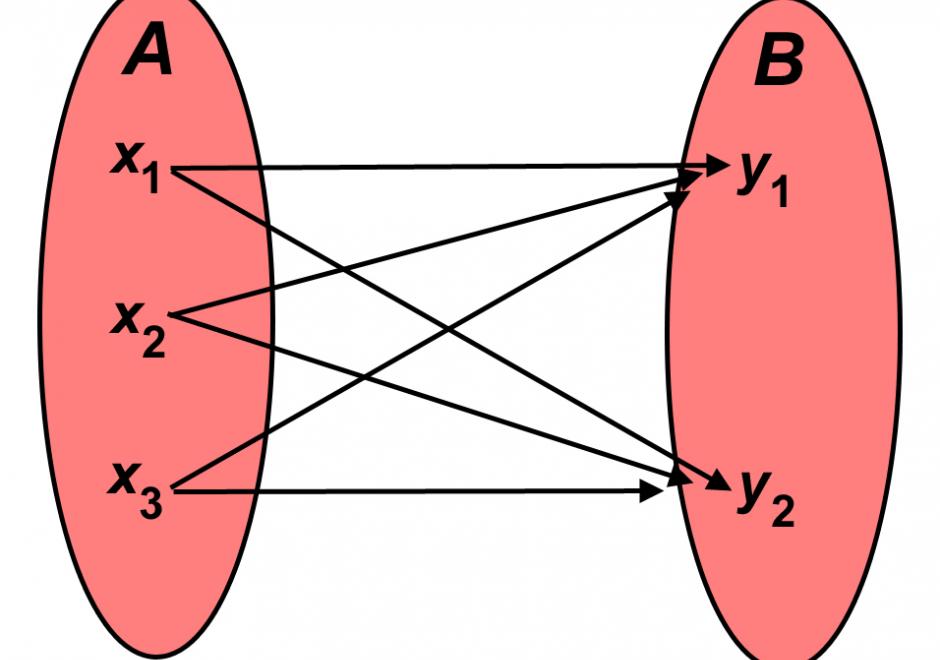
Basic mathematical set theory is presented and illustrated with a few examples from GIS. The focus is on set theory first, with subsequent interpretation in some GIS contexts ranging from story maps to municipal planning to language use. The breadth of interpretation represents not only the foundational universality of set theory within the broad realm of GIS but is also reflective of set theory's fundamental role in mathematics and its numerous applications. Beyond the conventional, the reader is taken to see glimpses of set theory not commonly experienced in the world of GIS and asked to imagine where else they might apply. Initial broad exposure leaves room for the mind to grow into deep and rich fields flung far across the globe of academia. Direction toward such paths is offered within the text and in additional resources, all designed to broaden the horizons of the open-minded reader.

FC-15 - Shape

Shape is important in GI Science because the shape of a geographical entity can have far-reaching effects on significant characteristics of that entity. In geography we are mainly concerned with two-dimensional shapes such as the outlines of islands, lakes, and administrative areas, but three-dimensional shapes may become important, for example in the treatment of landforms. Since the attribute of shape has infinitely many degrees of freedom, there can be no single numerical measure such that closely similar shapes are assigned close numerical values. Therefore different shape descriptors have been proposed for different purposes. Although it is generally desirable for a shape descriptor to be scale invariant and rotation invariant, not all proposed descriptors satisfy both these requirements. Some methods by which a shape is described using a single number are described, followed by a discussion of moment-based approaches. It is often useful to represent a complex shape by means of a surrogate shape of simpler form which facilitates storage, manipulation, and comparison between shapes; some examples of commonly used shape surrogates are presented. Another important task is to compare different shapes to determine how similar they are. The article concludes with a discussion of a number of such measures of similarity.

AM-84 - Simulation Modeling

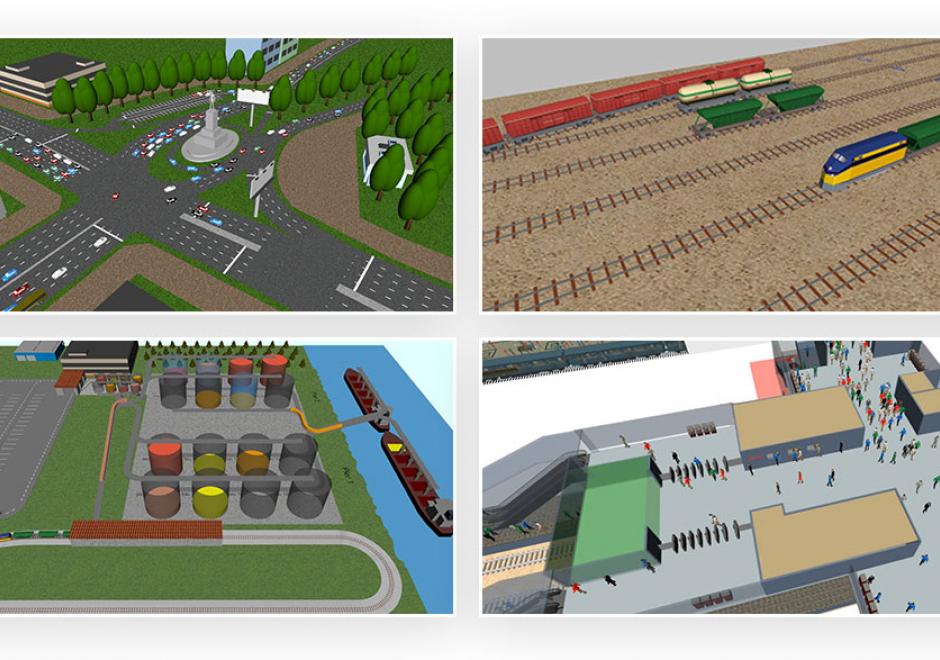
Advances in computational capacity have enabled dynamic simulation modeling to become increasingly widespread in scientific research. As opposed to conceptual or physical models, simulation models enable numerical experimentation with alternative parametric assumptions for a given model design. Numerous design choices are made in model development that involve continuous or discrete representations of time and space. Simulation modeling approaches include system dynamics, discrete event simulation, agent-based modeling, and multi-method modeling. The model development process involves a shift from qualitative design to quantitative analysis upon implementation of a model in a computer program or software platform. Upon implementation, model analysis is performed through rigorous experimentation to test how model structure produces simulated patterns of behavior over time and space. Validation of a model through correspondence of simulated results with observed behavior facilitates its use as an analytical tool for evaluating strategies and policies that would alter system behavior.

CP-10 - Social Media Analytics

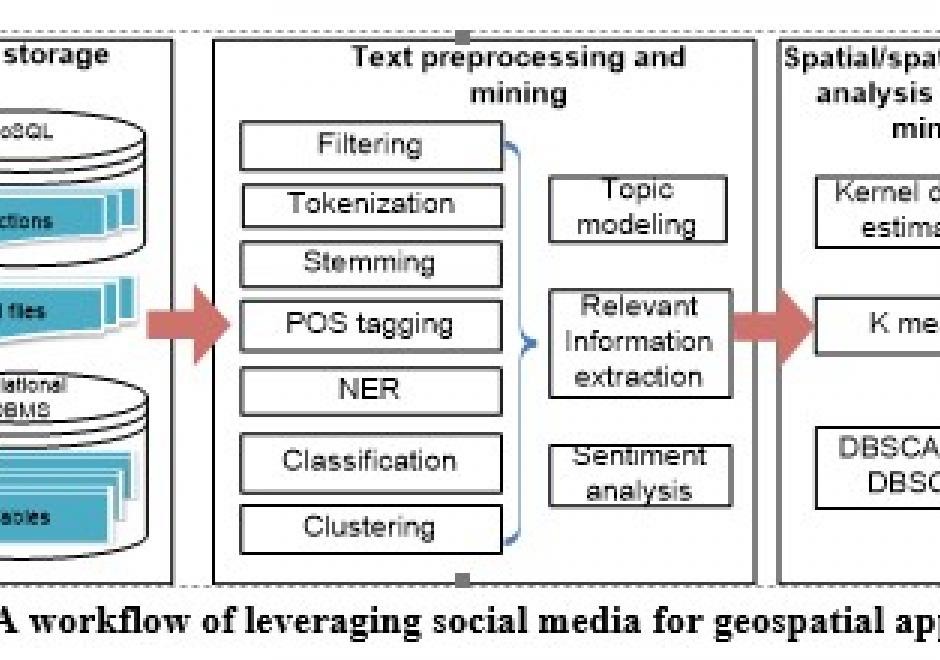
Social media streams have emerged as new sources to support various geospatial applications. However, traditional geospatial tools and systems lack the capacities to process such data streams, which are generated dynamically in extremely large volumes and with versatile contents. Therefore, innovative approaches and frameworks should be developed to detect an emerging event discussed over the social media, understand the extent, consequences of the event, as well as it time-evolving nature, and eventually discover useful patterns. In order to harness social media for geospatial applications, this entry introduces social media analytics technologies for harvesting, managing, mining, analyzing and visualizing the spatial, temporal, text, and network information of social media data.

DC-04 - Social Media Platforms

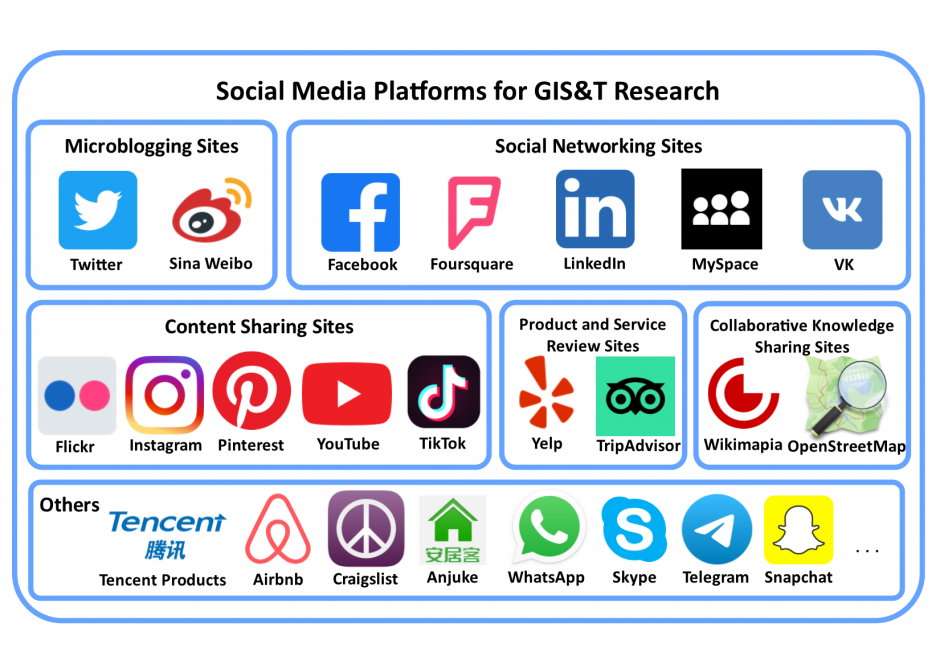
Social media is a group of interactive Web 2.0 Internet-based applications that allow users to create and exchange user-generated content via virtual communities. Social media platforms have a large user population who generate massive amounts of digital footprints, which are valuable data sources for observing and analyzing human activities/behavior. This entry focuses on social media platforms that provide spatial information in different forms for Geographic Information Systems and Technology (GIS&T) research. These social media platforms can be grouped into six categories: microblogging sites, social networking sites, content sharing sites, product and service review sites, collaborative knowledge sharing sites, and others. Four methods are available for capturing data from social media platforms, including Web Application Programming Interfaces (Web APIs), Web scraping, digital participant recruitment, and direct data purchasing. This entry first overviews the history, opportunities, and challenges related to social media platforms. Each category of social media platforms is then introduced in detail, including platform features, well-known platform examples, and data capturing processes.

CP-21 - Social Networks

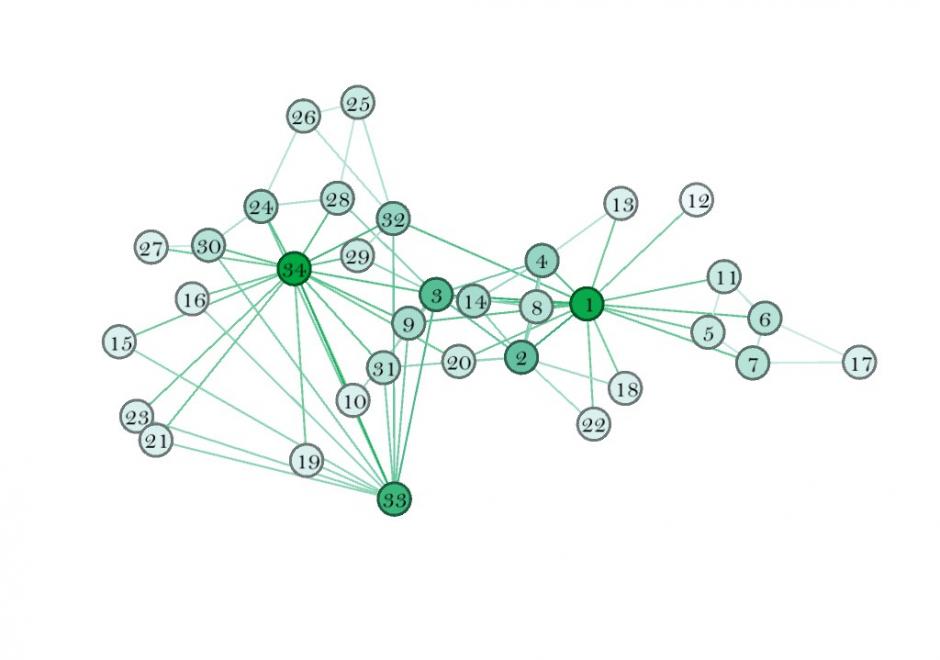
This entry introduces the concept of a social network (SN), its components, and how to weight those components. It also describes some spatial properties of SNs, and how to embed SNs into GIS. SNs are graph structures that consists of nodes and edges that traditionally exist in Sociology and are newer to GIScience. Nodes typically represent individual entities such as people or institutions, and edges represent interpersonal relationships, connections or ties. Many different mathematical metrics exist to characterize nodes, edges and the larger network. When geolocated, SNs are part of a class of spatial networks, more specifically, geographic networks (i.e. road networks, hydrological networks), that require special treatment because edges are non-planar, that is, they do not follow infrastructure or form a vector on the earth’s surface. Future research in this area is likely to take advantage of 21st Century datasets sourced from social media, GPS, wireless signals, and online interactions that each evidence geolocated personal relationships.

FC-37 - Spatial Autocorrelation

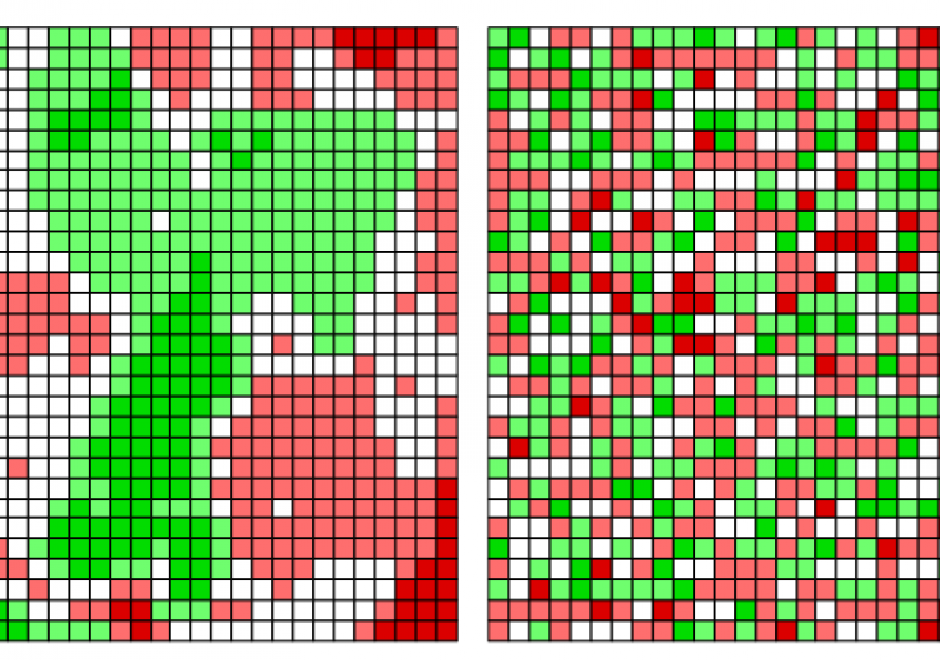
The scientific term spatial autocorrelation describes Tobler’s first law of geography: everything is related to everything else, but nearby things are more related than distant things. Spatial autocorrelation has a:

  • past characterized by scientists’ non-verbal awareness of it, followed by its formalization;
  • present typified by its dissemination across numerous disciplines, its explication, its visualization, and its extension to non-normal data; and
  • an anticipated future in which it becomes a standard in data analytic computer software packages, as well as a routinely considered feature of space-time data and in spatial optimization practice.

Positive spatial autocorrelation constitutes the focal point of its past and present; one expectation is that negative spatial autocorrelation will become a focal point of its future.

AM-32 - Spatial Autoregressive Models

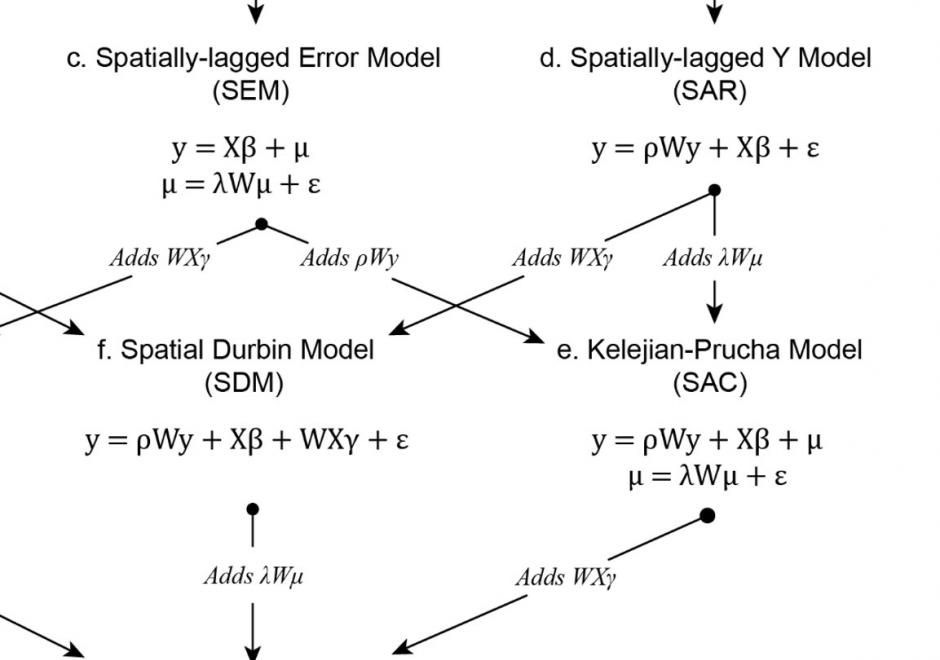
Regression analysis is a statistical technique commonly used in the social and physical sciences to model relationships between variables. To make unbiased, consistent, and efficient inferences about real-world relationships a researcher using regression analysis relies on a set of assumptions about the process generating the data used in the analysis and the errors produced by the model. Several of these assumptions are frequently violated when the real-world process generating the data used in the regression analysis is spatially structured, which creates dependence among the observations and spatial structure in the model errors. To avoid the confounding effects of spatial dependence, spatial autoregression models include spatial structures that specify the relationships between observations and their neighbors. These structures are most commonly specified using a weights matrix that can take many forms and be applied to different components of the spatial autoregressive model. Properly specified, including these structures in the regression analysis can account for the effects of spatial dependence on the estimates of the model and allow researchers to make reliable inferences. While spatial autoregressive models are commonly used in spatial econometric applications, they have wide applicability for modeling spatially dependent data.

Pages