All Topics

A B C D E F G H I J K L M N O P R S T U V W
CV-14 - Terrain Representation

Terrain representation is the manner by which elevation data are visualized. Data are typically stored as 2.5D grid representations, including digital elevation models (DEMs) in raster format and triangulated irregular networks (TINs). These models facilitate terrain representations such as contours, shaded relief, spot heights, and hypsometric tints, as well as automate calculations of surface derivatives such as slope, aspect, and curvature. 3D effects have viewing directions perpendicular (plan), parallel (profile), or panoramic (oblique view) to the elevation’s vertical datum plane. Recent research has focused on automating, stylizing, and enhancing terrain representations. From the user’s perspective, representations of elevation are measurable or provide a 3D visual effect, with much overlap between the two. The ones a user can measure or derive include contours, hypsometric tinting, slope, aspect, and curvature. Other representations focus on 3D effect and may include aesthetic considerations, such as hachures, relief shading, physiographic maps, block diagrams, rock drawings, and scree patterns. Relief shading creates the 3D effect using the surface normal and illumination vectors with the Lambertian assumption. Non-plan profile or panoramic views are often enhanced by vertical exaggeration. Cartographers combine techniques to mimic or create mapping styles, such as the Swiss-style.

AM-42 - The Classic Transportation Problem
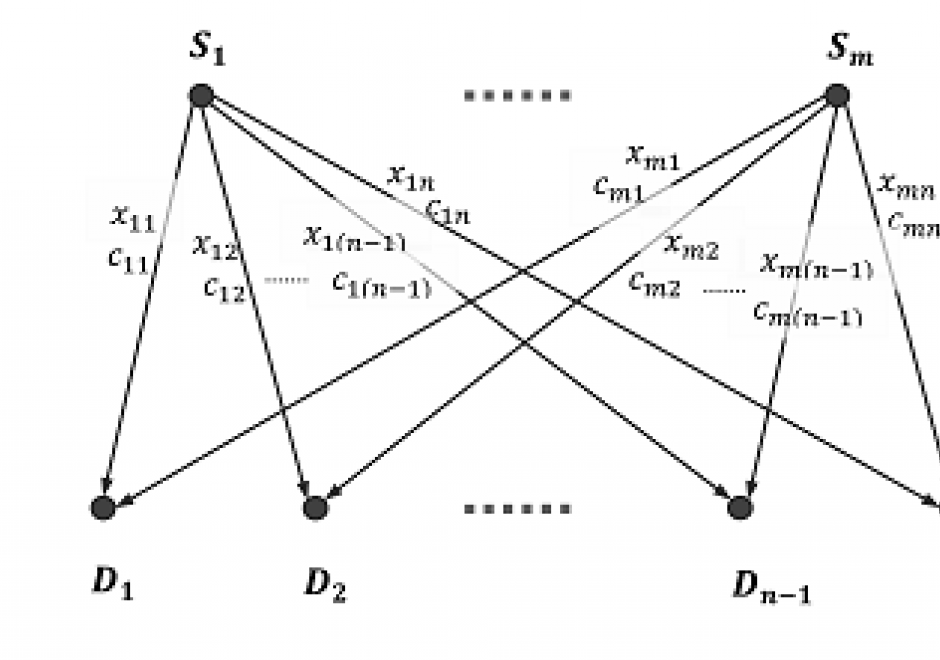
The classic transportation problem concerns minimizing the cost of transporting a product from sources/supplies to destinations/demands. It is a network-flow problem that arises in industrial logistics and is often solved by linear programming (LP). The three inputs of the model are total units produced at each source, total units needed at each destination, and the cost to transport one unit from each source to each destination. And the objective is to minimize the total cost of transporting all units produced at sources to meet the demands at destinations. The problem solution includes three basic steps: 1) finding an initial basic feasible solution, 2) checking if the current solution is optimal (with the lowest costs), and improving the current solution through iteration. Solving such a problem relies strongly on the network data models, least-cost path algorithms, other functionalities in GIS. And an integrated framework is often adopted to utilize both GIS and non-GIS linear programming solvers to search for the optimal solution.

AM-21 - The Evolution of Geospatial Reasoning, Analytics, and Modeling

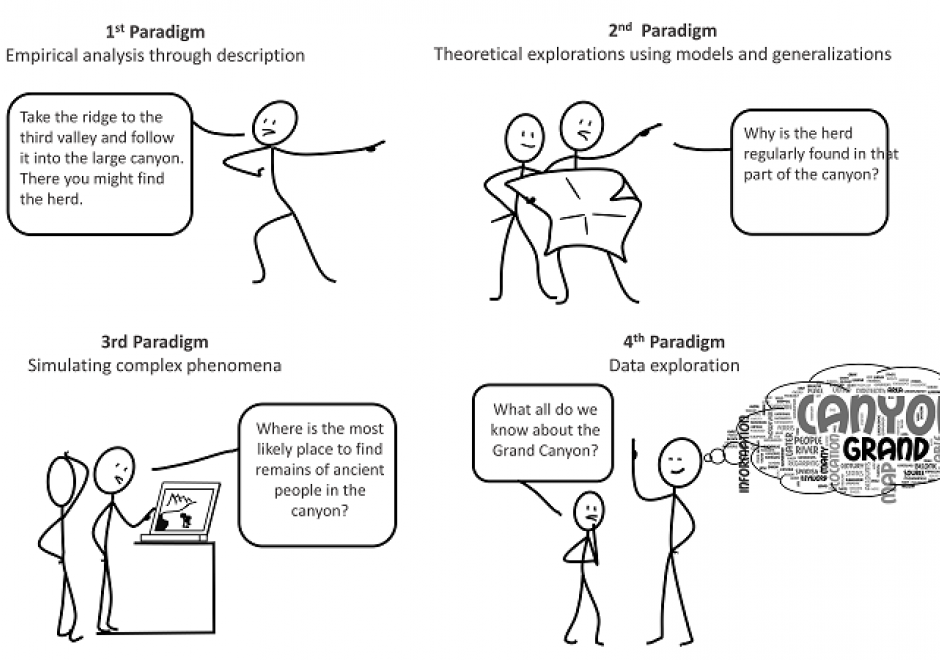
The field of geospatial analytics and modeling has a long history coinciding with the physical and cultural evolution of humans. This history is analyzed relative to the four scientific paradigms: (1) empirical analysis through description, (2) theoretical explorations using models and generalizations, (3) simulating complex phenomena and (4) data exploration. Correlations among developments in general science and those of the geospatial sciences are explored. Trends identify areas ripe for growth and improvement in the fourth and current paradigm that has been spawned by the big data explosion, such as exposing the ‘black box’ of GeoAI training and generating big geospatial training datasets. Future research should focus on integrating both theory- and data-driven knowledge discovery.

AM-34 - The Geographically Weighted Regression Framework

Local multivariate statistical models are increasingly encountered in geographical research to estimate spatially varying relationships between a response variable and its associated predictor variables. In geography and many other disciplines, such models have been largely embedded within the framework of regression and can reveal significantly more information about the determinants of observed spatial distribution of the dependent variable than their global regression model counterparts. This section introduces one type of local statistical modeling framework: Geographically Weighted Regression (GWR). Models within this framework estimate location-specific parameter estimates for each covariate, local diagnostic statistics, and bandwidth parameters as indicators of the spatial scales at which the modeled processes operate. These models provide an effective means to estimate how the same factors may evoke different responses across locations and by so doing, bring to the fore the role of geographical context on human preferences and behavior.

DM-07 - The Raster Data Model

The raster data model is a widely used method of storing geographic data. The model most commonly takes the form of a grid-like structure that holds values at regularly spaced intervals over the extent of the raster. Rasters are especially well suited for storing continuous data such as temperature and elevation values, but can hold discrete and categorical data such as land use as well.  The resolution of a raster is given in linear units (e.g., meters) or angular units (e.g., one arc second) and defines the extent along one side of the grid cell. High (or fine) resolution rasters have comparatively closer spacing and more grid cells than low (or coarse) resolution rasters, and require relatively more memory to store. Active research in the domain is oriented toward improving compression schemes and implementation for alternative cell shapes (such as hexagons), and better supporting multi-resolution raster storage and analysis functions.

FC-27 - Thematic Accuracy Assessment

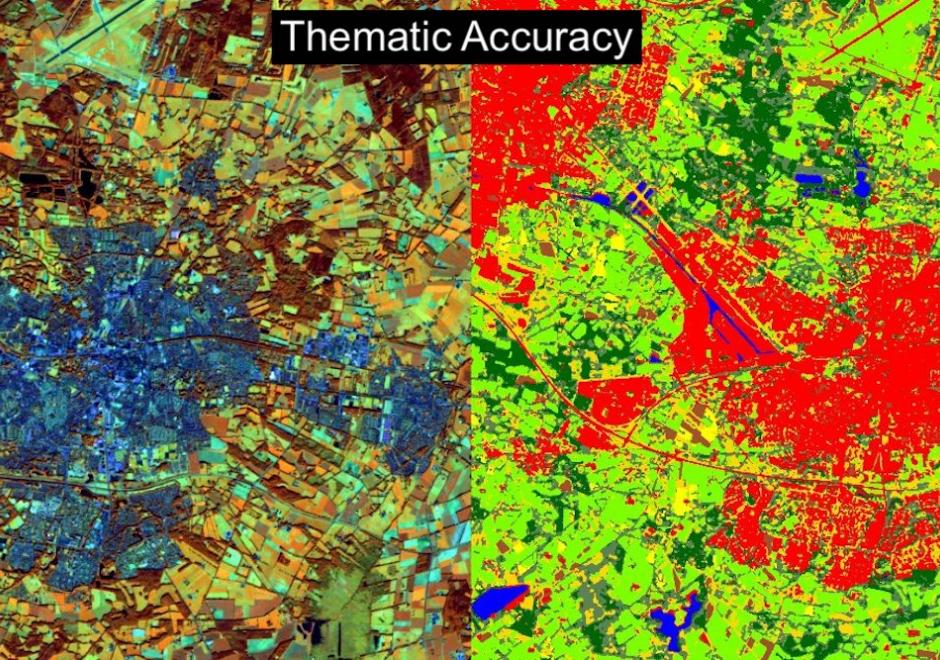
Geographic Information System (GIS) applications often involve various analytical techniques and geographic data to produce thematic maps for gaining a better understanding of geospatial situations to support spatial decisions. Accuracy assessment of a thematic map is necessary for evaluating the quality of the research results and ensuring appropriate use of the geographic data. Thematic accuracy deals with evaluating the accuracy of the attributes or labels of mapped features by comparing them to a reference that is assumed to be true. The fundamental practice presents the remote sensing approach to thematic accuracy assessment as a good guidance. For instance, the accuracy of a remote sensing image can be represented as an error matrix when the map and reference classification are conducted based on categories. This entry introduces basic concepts and techniques used in conducting thematic accuracy with an emphasis on land cover classification based on remote sensing images. The entry first introduces concepts of spatial uncertainty and spatial data quality standards and further gives an example of how spatial data quality affects thematic accuracy. Additionally, the entry illustrates the techniques that can be used to access thematic accuracy as well as using spatial autocorrelation in thematic accuracy sampling design.

FC-08 - Time

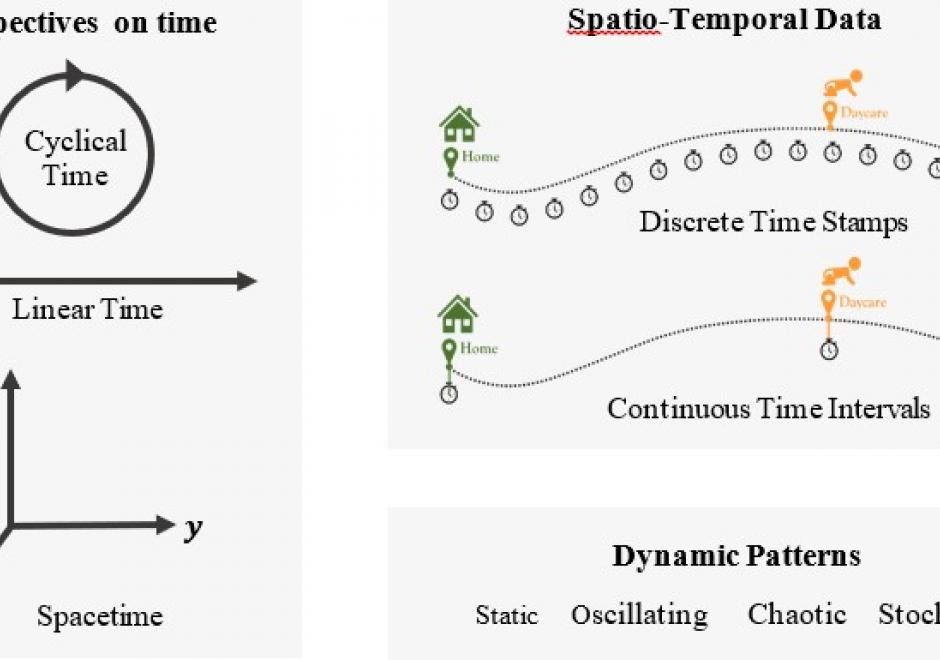
Time is a fundamental concept in geography and many other disciplines. This article introduces time at three levels. At the philosophical level, the article reviews various notions on the nature of time from early mythology to modern science and reveals the dual nature of reality: external (absolute, physical) and internal (perceived, cognitive). At the analytical level, it introduces the measurement of time, the two frames of temporal reference: calendar time and clock time, and the standard time for use globally. The article continues to discuss time in GIS at the practical level. The GISystem was first created as a “static” computer-based system that stores the present status of a dynamic system. Now, GISystems can track and model the dynamics in geographical phenomena and human-environment interactions. Representations of time in dynamic GISystems adopt three perspectives: discrete time, continuous time and Minkowski’s spacetime, and three representations: ordinal, interval, and cyclical. The appropriate perspective and representation depend on the observed temporal patterns, which can be static, oscillating, chaotic, or stochastic. Recent progress in digital technology brings us opportunities and challenges to collect, manage and analyze spatio-temporal data to advance our understanding of dynamical phenomena.

DC-39 - Time-of-Arrival (TOA) Localization for Indoor GIS

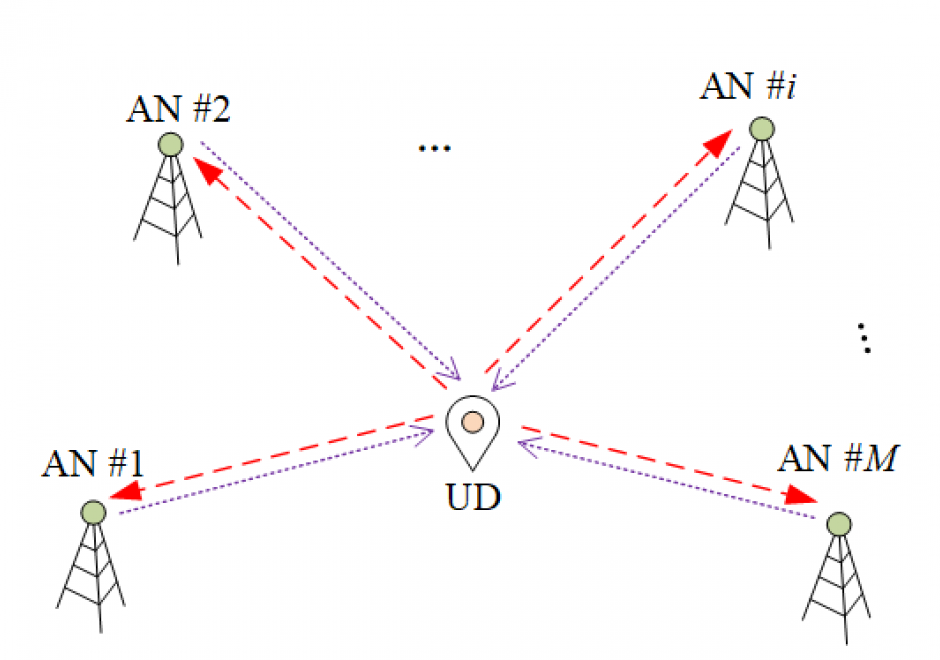
Indoor geographic information system (GIS) opens up a new frontier for identifying, analyzing and solving complex problems. In many indoor GIS-driven applications such as indoor wayfinding and logistics planning and management, determination of location information deserves special attention because global positioning system (GPS) may be inaccessible. Alternative methods and systems have emerged to overcome this hurdle. The time-of-arrival (TOA) measurement is one of the most adopted metrics in numerous modern systems such as radar, acoustic/ultra-sound-based tracking, ultra-wide band (UWB) indoor localization, wireless sensor networks (WSN) and Internet of things (IoT) localization. This topic presents the TOA technique and methods to solve the localization and synchronization problem. We also introduce variants of the TOA system schemes, which are adopted by real-world applications. As a use case of the TOA technique realized in practice, a UWB localization system is introduced. Examples are given to demonstrate that indoor localization and GIS are tightly interconnected.

DM-10 - Triangular Irregular Network (TIN) Models

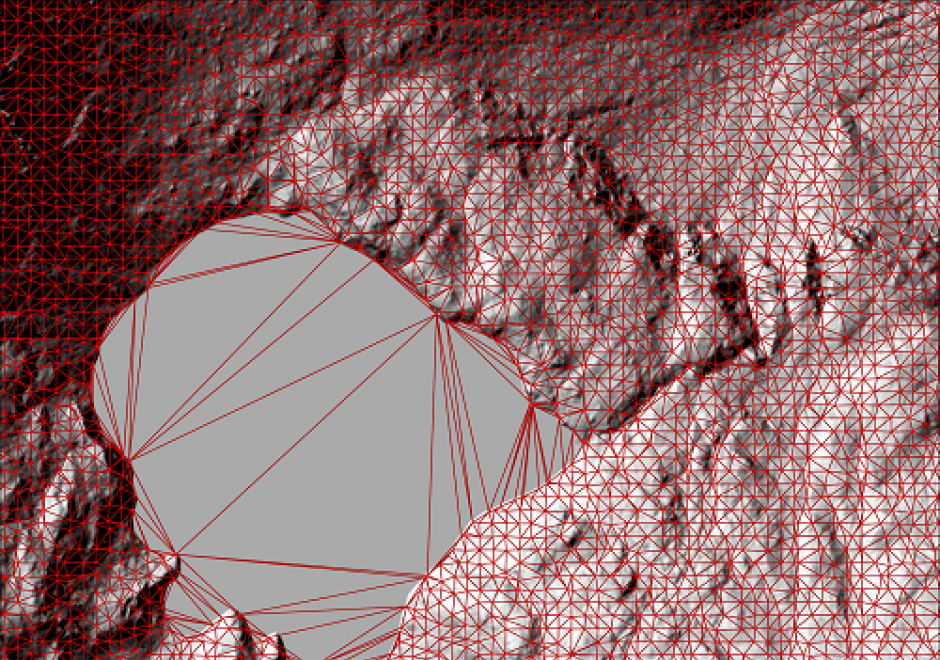
A Triangular Irregular Network (TIN) is a way of storing continuous surfaces. It is vector based, and works in such a way that it connects known data points with straight lines to create triangles, often called facets. These facets are planes that have the same slope and aspect over the facet. Collectively, these hypothetical lines form a network covering the whole surface. TINs are efficient when storing heterogeneous surfaces, since homogenous areas are stored using few data points, while areas with more variability are stored in detail using a larger number of data points. In other words, a TIN can be more detailed where the surface is complex (high variation) by using smaller facets, and less detailed where the surface is more homogeneous by using larger facets. TINs also have a high modelling potential, e.g. in topography and hydrology. However, the unique way of storing data an a TIN often makes it difficult to combine with other spatial data formats. Instead, the TIN data would usually be converted to other suitable formats.

CV-10 - Typography

The selection of appropriate type on maps, far from an arbitrary design decision, is an integral part of establishing the content and tone of the map. Typefaces have personalities, which contribute to the rhetorical message of the map. It is important to understand how to assess typefaces for their personalities, but also to understand which typefaces may be more or less legible in a labeling context. Beyond the choice of typeface, effective map labels will have a visual hierarchy and allow the user to easily associate labels to their features and feature types. The cartographer must understand and modify typographic visual variables to support both the hierarchy and label-feature associations.